Cardano (ADA) Finds Support above $2.00, Continues Its Sideways Move
Estimated Reading Time: 2 minutes
Don’t invest unless you’re prepared to lose all the money you invest. This is a high-risk investment and you are unlikely to be protected if something goes wrong. Take 2 minutes to learn more

Cardano (ADA) Long-Term Analysis: Ranging
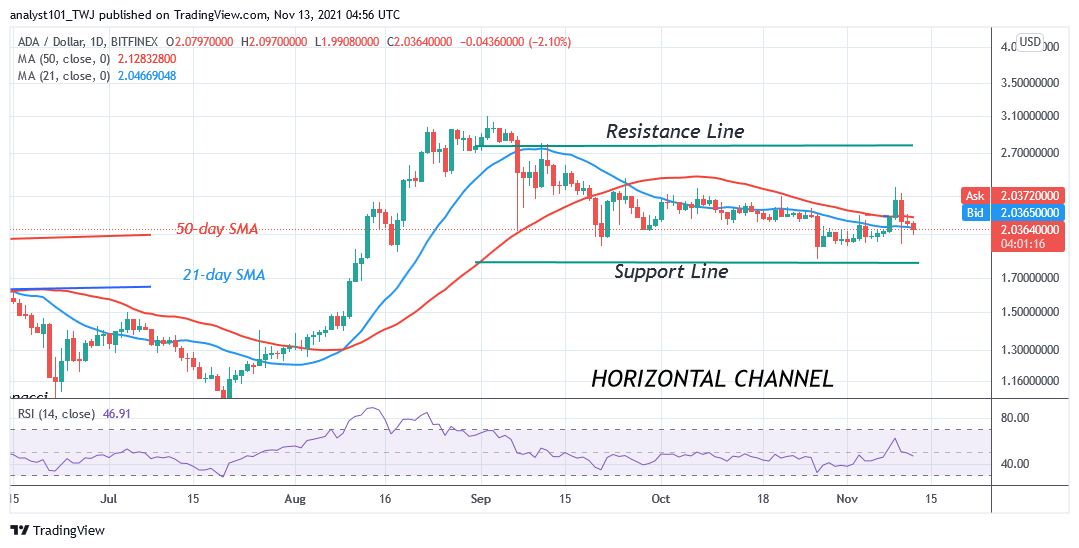
Cardano’s (ADA) price is still in a sideways move. The price bars are above the 21-day SMA but below the 50-day SMA. On November 9, ADA price rebounded above the $2.0 support as price broke above the moving averages. The bullish momentum was stalled at the $2.40 resistance. Sellers push price back to the previous low and pulled back. The candlestick with long tails is pointing to the $1.80 support. Those long tails are indicating that the $1.80 support is a strong buying pressure. Meanwhile, Cardano will be in a range-bound move until these levels are breached.
Cardano (ADA) Indicator Analysis
Cardano is at level 47 of the Relative Strength Index period 14. The cryptocurrency is in the downtrend zone and below the centerline 50. The 21-day SMA and the 50-day SMA are sloping horizontally. The market is above the 25% range of daily stochastic. It indicates that the altcoin is in a bullish momentum.
Technical indicators:
Major supply zones: $2.0, $2.20, $2.40
Major demand zones: $1.40, $1.20, $1.00
What Is the Next Direction for Cardano (ADA)?
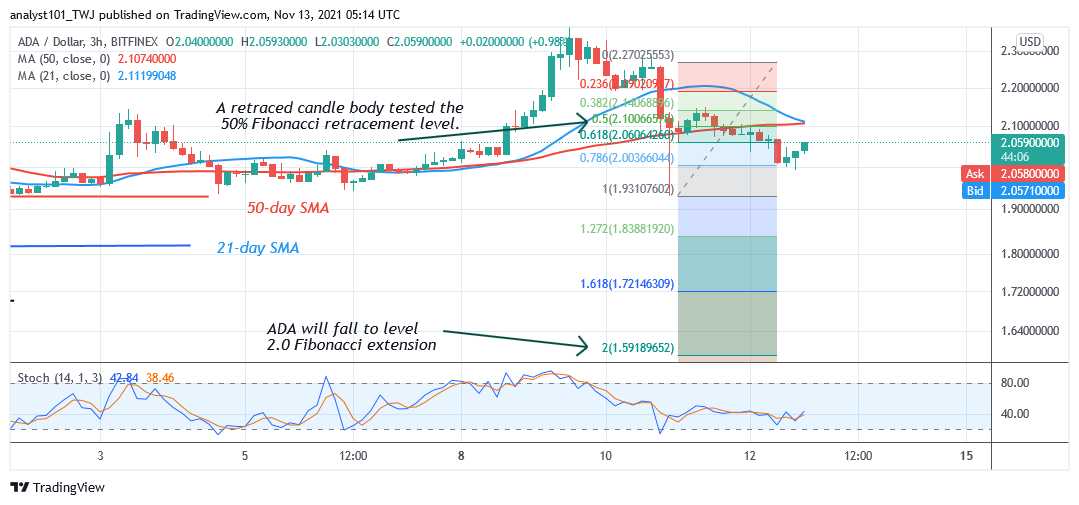
Cardano is in a downward move. The bears have broken below the moving averages. Meanwhile, on November 11 downtrend; a retraced candle body tested the 50% Fibonacci retracement level. The retracement indicates that Cardano will fall to level 2.0 Fibonacci extension or $1.59. From the price action, the market declined to the low of $2.00 and reversed.
You can purchase crypto coins here. Buy Token
Note: Cryptosignals.org is not a financial advisor. Do your research before investing your funds in any financial asset or presented product or event. We are not responsible for your investing results