Cardano (ADA) Is in a Downward Correction, Battles the Resistance at $2.30
Estimated Reading Time: 2 minutes
Don’t invest unless you’re prepared to lose all the money you invest. This is a high-risk investment and you are unlikely to be protected if something goes wrong. Take 2 minutes to learn more
Cardano (ADA) Long-Term Analysis: Bearish
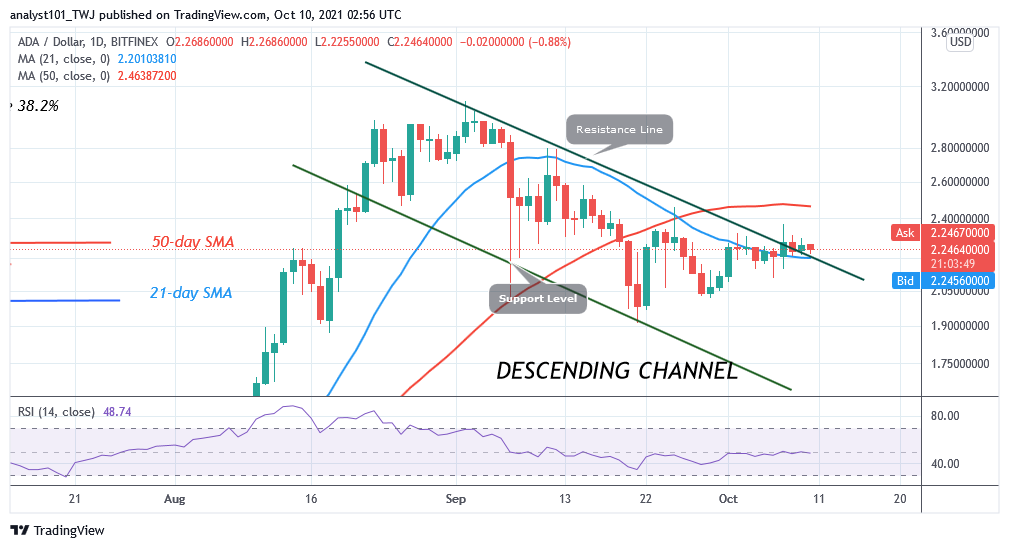
Cardano’s (ADA) price is in a range bound move below the $2.30 resistance level. Since October 2, buyers are finding penetration difficult at the $2.30 resistance. In the first uptrend, on October 2, buyers were repelled at the $2.30 resistance. ADA price fell and resumed a downward correction. The altcoin fell to the low of $2.13 and resumed a fresh uptrend. On October 7, the bulls were resisted as the altcoin resumed another downward correction. Cardano is now trading below the $2.30 resistance. If the bulls break the resistance at $2.30, the market will rally above $2.60.
Technical indicators:
Major supply zones: $2.0, $2.20, $2.40
Major demand zones: $1.40, $1.20, $1.00
Cardano (ADA) Indicator Analysis
Cardano is at level 49 of the Relative Strength Index period 14. It indicates that there is a balance between supply and demand. The crypto is consolidating below the$2.30 resistance as the price movement is insignificant. The cryptos price is still above the 21-day SMA but below the 50-day SMA. When price breaks above 50-day SMA, the altcoin will resume up trending. The altcoin is above the 50% range of daily stochastic. The market is in a bullish momentum.
What Is the Next Direction for Cardano (ADA)?
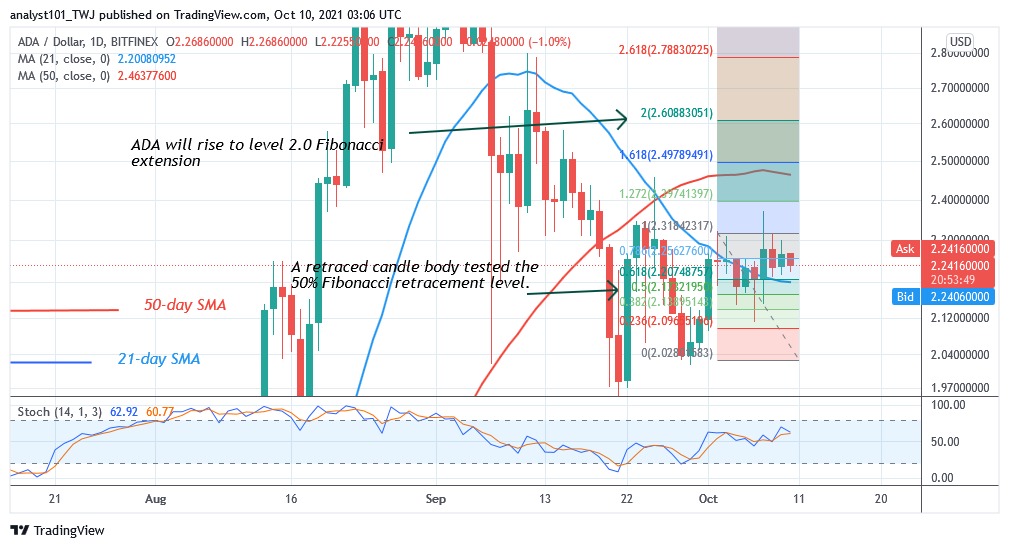
Cardano is in a downward correction. The uptrend is facing resistance at $2.30. If the bulls break the current resistance, the Fibonacci tool analysis will hold. Meanwhile, on October 2 uptrend; a retraced candle body tested the 50% Fibonacci retracement level. The retracement indicates that ADA is likely to rise to level 2.0 Fibonacci extension or level $2.60.
You can purchase crypto coins here. Buy Token
Note: Cryptosignals.org is not a financial advisor. Do your research before investing your funds in any financial asset or presented product or event. We are not responsible for your investing results