Hedera Hashgraph (HBAR/USD) Bulls Exert More Pressure on the $0.06 Resistance Threshold
Estimated Reading Time: 2 minutes
Don’t invest unless you’re prepared to lose all the money you invest. This is a high-risk investment and you are unlikely to be protected if something goes wrong. Take 2 minutes to learn more
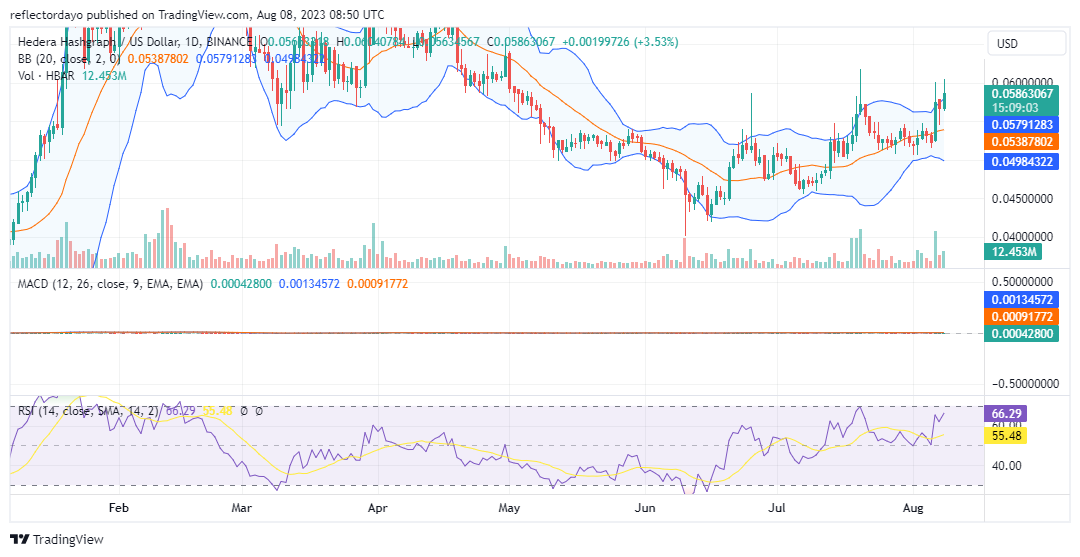
In the Hedera Hashgraph market, the price levels at $0.06 and $0.055 have consistently served as resistance points since June 25. The price movement has repeatedly challenged this resistance range and notably breached the $0.06 mark after July 20. Despite the underlying support level initially being below $0.055, recent sessions indicate the emergence of a stronger support level above $0.055.
HBAR Market Data
- HBAR/USD Price Now: $0.0584
- HBAR/USD Market Cap: $1.9 billion
- HBAR/USD Circulating Supply: 32,559,526,344 HBAR
- HBAR/USD Total Supply: 50,000,000,000
- HBAR/USD CoinMarketCap Ranking: #30
Key Levels
- Resistance: $0.060, $0.065, and $0.070.
- Support: $0.055, $0.050, and $0.045.
Price Prediction for Hedera Hashgraph: The Indicators’ Point of View
Prior to mid-June, the Hedera Hashgraph market was in a downtrend until it established firm footing around $0.042. Subsequently, an uptrend commenced. Additionally, since that point in time, the market has witnessed an escalation in volatility. This uptick in volatility has reinvigorated the bear market, leading to a substantial gap between the support and resistance levels. Nevertheless, the bulls currently hold the advantage as they exert upward pressure on the bears. Given the establishment of a robust support level, there is a likelihood of breaching the $0.06 resistance level.
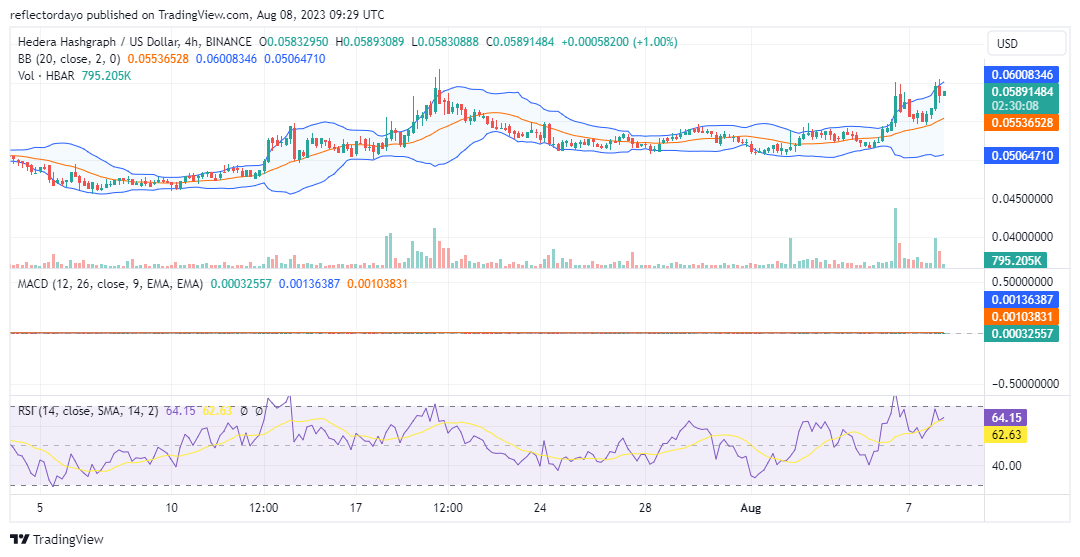
HBAR/USD 4-Hour Chart Outlook
Upon reviewing the 4-hour chart, we observe the expansion of the Bollinger Bands, indicating potential unpredictability in price movement. Nevertheless, due to the establishment of a higher support level by the bull market, their prospects outweigh those of the bears. Traders should closely monitor the potential breach of the $0.06 resistance level so that they will be able to ascertain the next direction of the market.