Quant Price Prediction: QNT/USD Can Sustain Gain Above $125 Level
Estimated Reading Time: 2 minutes
Don’t invest unless you’re prepared to lose all the money you invest. This is a high-risk investment and you are unlikely to be protected if something goes wrong. Take 2 minutes to learn more
Quant Price Prediction – March 22
The Quant price prediction shows that QNT is getting ready to recover back above the moving averages after touching the $120 support.
QNT/USD Long-term Trend: Ranging (1D Chart)
Key Levels:
Resistance levels: $150, $160, $170
Support levels: $105, $95, $85
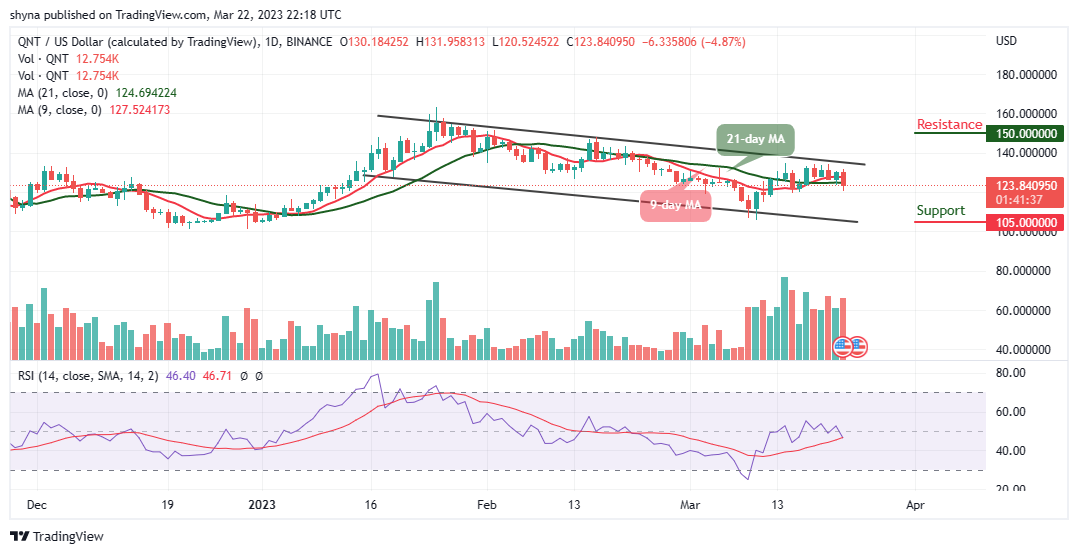
QNT/USD is ready to reclaim the $131 resistance level as the coin keeps recovering the lost resistance. The Quant price is currently trading at $123.8 after recovering from the daily low of $120.5; it could probably retest this level again before rising higher.
Quant Price Prediction: QNT Price Will Hit Higher Levels
The Quant price will soon cross above the upper boundary of the channel, a break above this barrier will encourage more buyers to increase their entries, which could hit the resistance levels of $150, $160, and $170. On the downside, if the price breakdown and face the lower boundary of the channel, the downside pressure may increase and the next support levels could be created at $105, $95, and $85 respectively. The technical indicator Relative Strength Index (14) nosedives below the 50-level, to allow more buyers to come into the market.
QNT/USD Medium-term Trend: Bullish (4H Chart)
The Quant price is hovering below the 9-day and 21-day moving averages as the coin faces the north. However, any bullish movement above the moving averages will encourage the buyers to extend the rally toward the resistance level of $138 and above.
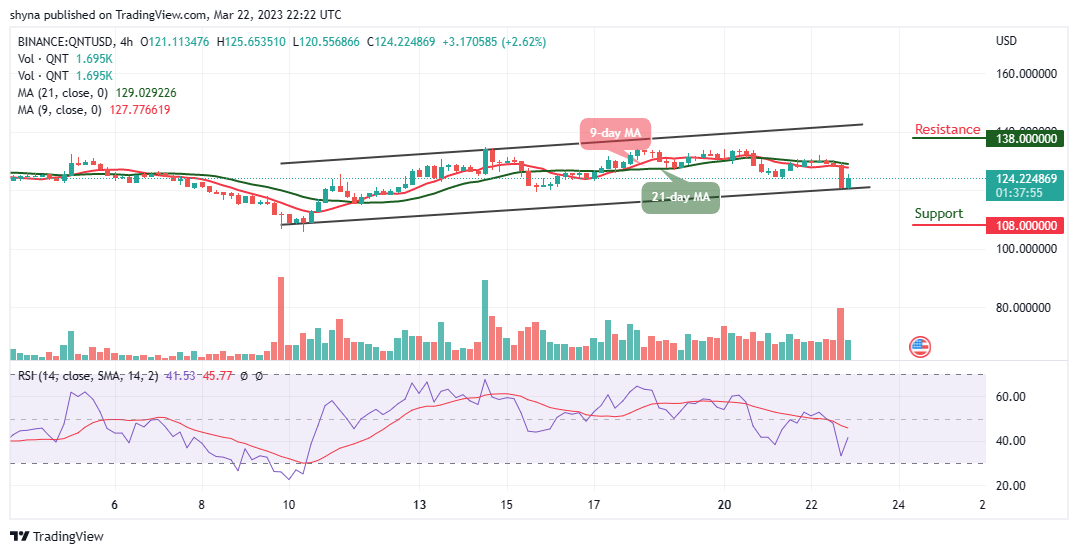
In other words, any bearish drop below the lower boundary of the channel could hit the support level of $108 and below. Meanwhile, there is a possibility that the Quant will begin the upward movement as the technical indicator Relative Strength Index (14) crosses above the 40-level.
Place winning Quant trades with us. Get QNT here