Quant Price Prediction: QNT/USD Trades Below $130; it’s Time to Invest
Estimated Reading Time: 2 minutes
Don’t invest unless you’re prepared to lose all the money you invest. This is a high-risk investment and you are unlikely to be protected if something goes wrong. Take 2 minutes to learn more
Quant Price Prediction – March 22
The Quant price prediction reveals that QNT drops to touch the daily low of $127 as the price dips for new buyers to surface.
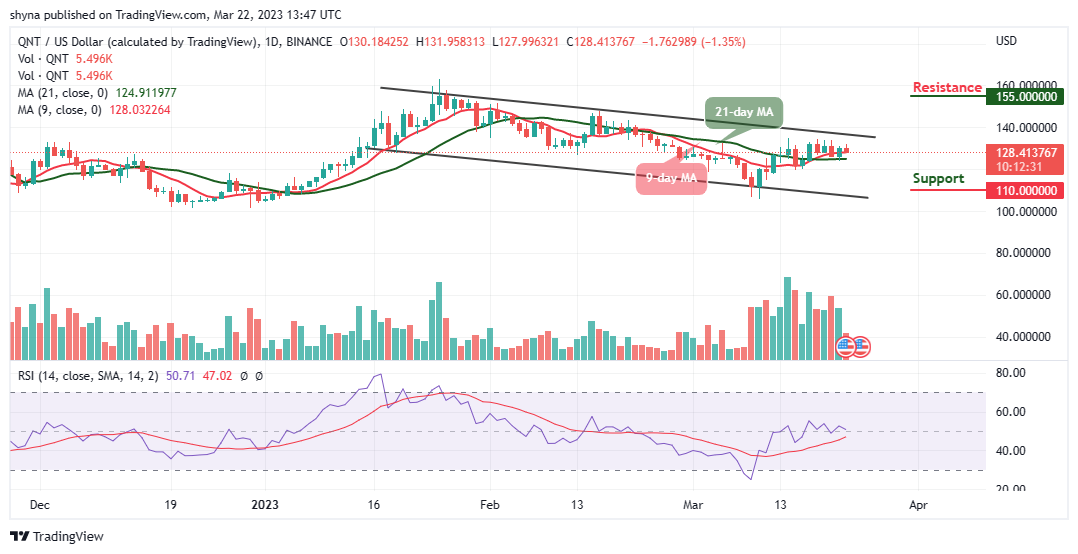
QNT/USD Medium-term Trend: Ranging (1D Chart)
Key Levels:
Resistance levels: $155, $165, $175
Support levels: $110, $100, $90
QNT/USD is trading at $128.4 hovering above the 9-day and 21-day moving averages. According to the daily chart, sellers are likely to push the coin towards the south and this could allow new buyers to step into the market while the existing buyers are expected to buy more.
Quant Price Prediction: QNT Price Retreats to Move Higher
The Quant price is ranging at the moment so that new buyers can come into the market. Meanwhile, the coin can drop more as the technical indicator Relative Strength Index (14) moves to cross below the 50-level as the existing buyers are expected to buy the dips but any further supports could be located at $110, $100, and $90.
Moreover, should the buyers hold the current support of $127.9, pushing it higher can hit the previous resistance level of $131. However, any further bullish movement above the upper boundary of the channel will locate the resistance levels at $155, $165, and $175.
QNT/USD Medium-term Trend: Ranging (4H Chart)
On the 4-hour chart, the Quant price keeps moving within the 9-day and 21-day moving averages, expecting new buyers to enter the market. Similarly, the existing buyers are to invest more as the coin dig dip.
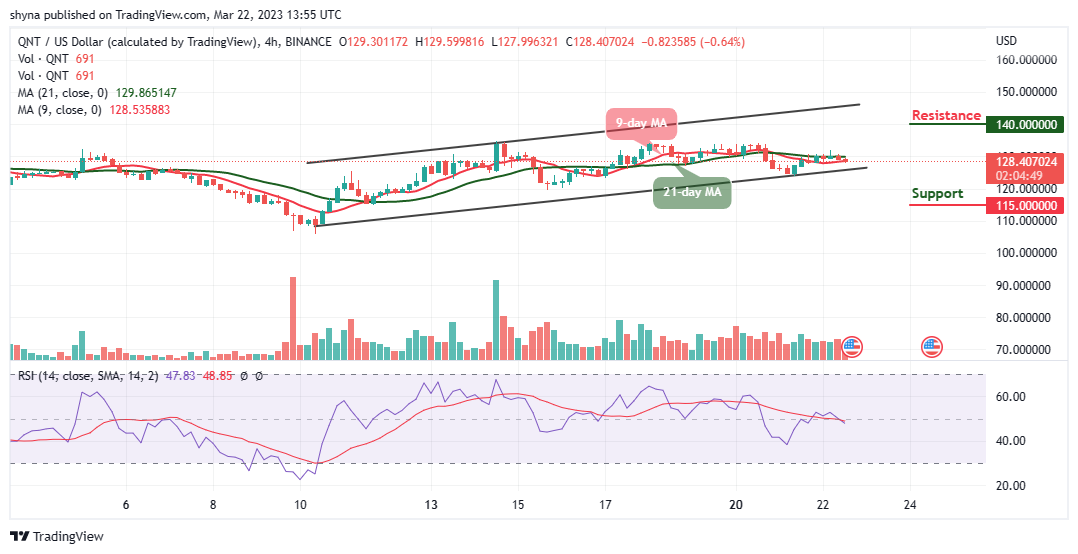
From the upside, if the buyers push the price above the moving averages; higher resistance could be found near the upper boundary of the channel at $140 and above. But, should the coin retreat and slide below the lower boundary of the channel, critical support can come at $115 and below, while the Relative Strength Index (14) moves to cross below the 50-level, suggesting that buyers are gathering momentum.
Place winning Quant trades with us. Get QNT here