Wall Street Memes (WSM) Trade Shifts, Price Spiral Holds Firm
Estimated Reading Time: 3 minutes
Don’t invest unless you’re prepared to lose all the money you invest. This is a high-risk investment and you are unlikely to be protected if something goes wrong. Take 2 minutes to learn more

Wall Street Memes Price Prediction – September 6
Wall Street Memes coin shows only a modest push, as it struggles to rebound strongly against the U.S. dollar; yet, with today’s base shift keeping the price spiral firm, sentiment leans cautiously optimistic.
Although Wall Street Memes coin struggles to stage a strong rebound against the U.S. dollar, today’s base shift reflects stability as the price spiral holds firm, indicating that underlying support levels are stabilizing and buyers may cautiously position for gradual upward traction. This positioning supports cautious optimism, with technical undercurrents suggesting buyers may gradually regain momentum despite lingering overhead pressures.
WSM/USD Market
Key Levels
Resistance levels: $0.0007, $0.0008, $0.0009
Support levels: $0.0004, $0.0003, $0.0002
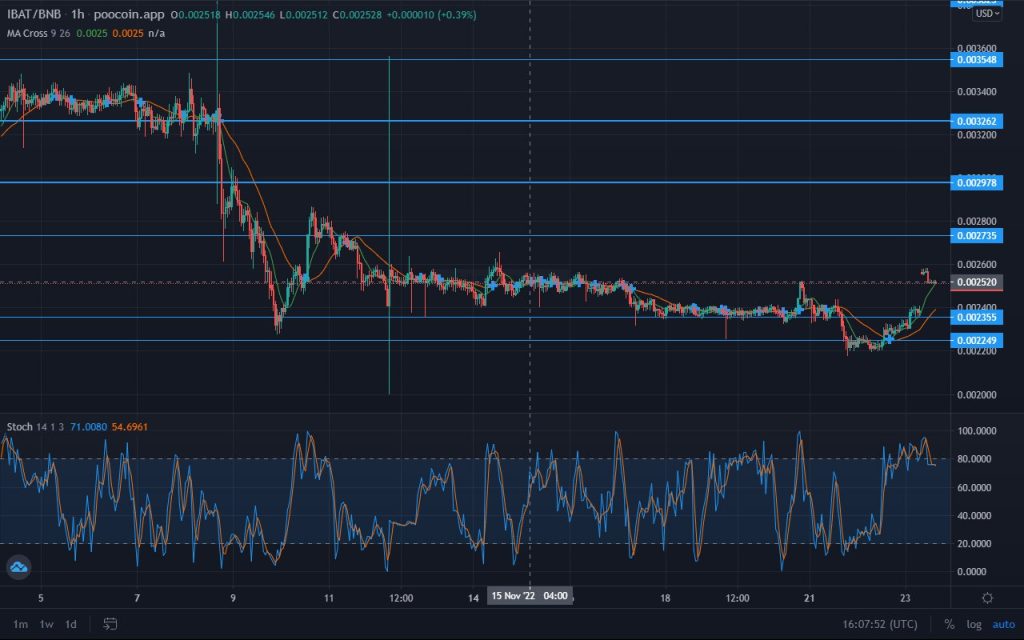
WSM/USD – 4-hour Chart
The WSM/USD medium-term chart reveals that the crypto-economic trade is presently shifting its basis as the price spiral holds firm.
The stochastic oscillators have extended their moves deeply into the oversold region, indicating that buyers are being driven to settle near fresh lows, as downside momentum continues to weigh against broader recovery attempts. The Bollinger Bands have also slipped below the lower baseline, further signaling sustained pressure.
Will the Crypto-Economic Trade Sustain Its Shifting Basis While the Price Spiral Continues to Hold Firm?
The WSM/USD trade can maintain its shifting basis as long as the price spiral holds firm, though buyers must watch for fading momentum that could restrict upside and invite corrective pressures.
For long-term holders, the WSM/USD trade shows encouraging structural firmness, as the price spiral’s stability suggests underlying support remains intact. While short-term momentum may fade, the broader trend continues to foster gradual accumulation, positioning buyers for potential value appreciation in extended horizons.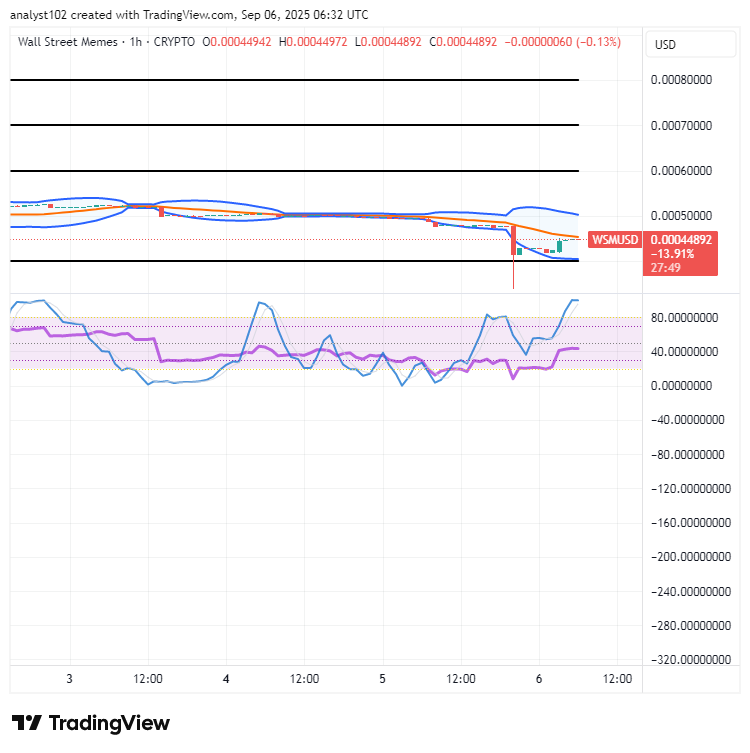
WSM/USD 1-hour chart
The 1-hour chart of the WSM/USD trade shows that the crypto-economic happenings have shifted slowly in a negative direction, as the price spiral holds firm.
The stochastic oscillators have moved northbound into the overbought region. The Bollinger Bands have slightly stretched southward, making the lower part go for a resettling pattern at lower fresh zones, thereby signaling caution as volatility broadens and potential corrections may emerge, though supportive buyers could still attempt stabilizing upward rebounds.
$WSM community, we definitely noticed all your amazing Tweets!
$WSM community, we saw your Tweets! 👏$WSM / $USDT is now tradeable on #Bybit Perpetuals.
— Bybit (@Bybit_Official) October 13, 2023
Trade here: https://t.co/le4XyVyXaZ
Also want your project listed? Share your suggestions here:https://t.co/W7EWJVVNV5 https://t.co/XgXoL7g0rF