Wall Street Memes (WSM) Market Relaxes, Poising for Spirals
Estimated Reading Time: 3 minutes
Don’t invest unless you’re prepared to lose all the money you invest. This is a high-risk investment and you are unlikely to be protected if something goes wrong. Take 2 minutes to learn more

Wall Street Memes Price Prediction – September 5
Buying forces are currently in a phase of regaining momentum, as Wall Street Memes coin’s valuation aligns with the U.S. dollar’s purchasing power, making the financial condition such that the crypto-economic market is relaxing and poising for spirals in its inputs.
The alignment of Wall Street Memes coin’s valuation with the U.S. dollar’s purchasing power reflects a stabilizing trend. This condition signals resilience, as the crypto-economic market steadies itself while preparing for potential upward spirals, showcasing investor confidence and renewed trading optimism.
WSM/USD Market
Key Levels
Resistance levels: $0.0007, $0.0008, $0.0009
Support levels: $0.0005, $0.0004, $0.0003
WSM/USD – 4-hour Chart
The WSM/USD medium-term chart showcases the crypto-economic market presently relaxing at a baseline, poised for spirals.
The Bollinger Bands indicators have kept to a stretching formation that is more eastward, validating the validity of basement procession around $0.0005. The stochastic oscillators have swerved southbound, pointing deeply in the oversold region, signaling the possibility of ending a downfall in price in the near future.
Will the WSM/USD Market Sustain Its Baseline Relaxation Before Spiraling Into Renewed Directional Momentum?
The WSM/USD market shows steadiness at baseline, yet subtle signals hint at potential volatility, leaving traders attentive for possible upward spirals and renewed directional momentum soon.
For long-term capitalists, the WSM/USD market’s baseline steadiness reflects resilience. Subtle signals of potential volatility may ultimately favor upward spirals, suggesting renewed momentum could strengthen value creation, enhance portfolio durability, and reward patient investors with sustained growth opportunities over extended horizons.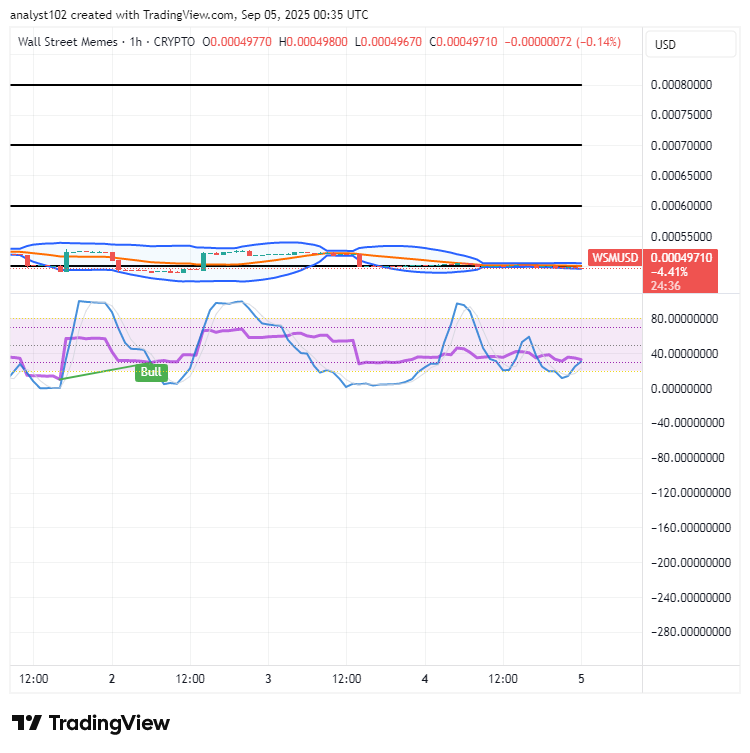
WSM/USD 1-hour chart
The 1-hour chart of the WSM/USD market showcases that the crypto-economic event is relaxing at a baseline, poised for spirals.
The stochastic oscillators continue a repositioning pattern, shifting across levels that emphasize a bullish bias. At the same time, the Bollinger Bands have widened modestly, reflecting bargaining pressures and order flows between the $0.00055 and $0.0005 range, indicating a possible buildup toward stronger directional momentum.
WSM /USDT is now tradeable on #Bybit Perpetuals, offering traders broader access and increased opportunities for strategic market positioning.
$WSM community, we saw your Tweets! 👏$WSM / $USDT is now tradeable on #Bybit Perpetuals.
— Bybit (@Bybit_Official) October 13, 2023
Trade here: https://t.co/le4XyVyXaZ
Also want your project listed? Share your suggestions here:https://t.co/W7EWJVVNV5 https://t.co/XgXoL7g0rF