Wall Street Memes (WSM) Trade Stables, Swing Traits Appear
Estimated Reading Time: 3 minutes
Don’t invest unless you’re prepared to lose all the money you invest. This is a high-risk investment and you are unlikely to be protected if something goes wrong. Take 2 minutes to learn more
Wall Street Memes Price Prediction – September 4
The frequency of minor downward trends in the Wall Street Memes coin compared to the American currency has been decreasing strategically, as the financial condition of the business stabilizes and swing traits emerge.
The WSM/USD market’s steady footing highlights investor confidence, while swing traits indicate room for extended momentum. With stabilization underway, emerging swing traits suggest momentum could build further. This supportive setup may encourage buyers to maintain confidence, keeping valuations steady while leaving room for potential upward moves.
WSM/USD Market
Key Levels
Resistance levels: $0.0007, $0.0008, $0.0009
Support levels: $0.0005, $0.0004, $0.0003
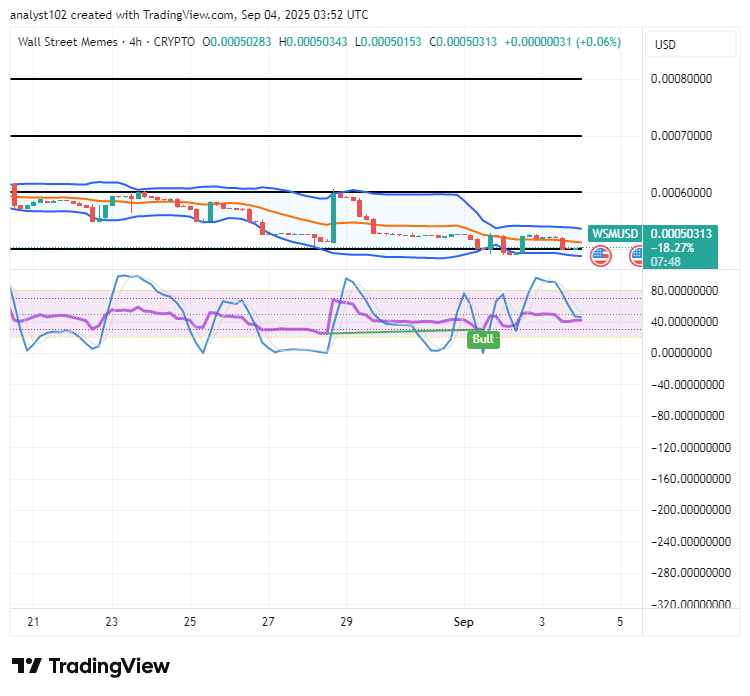
WSM/USD – 4-hour Chart
The WSM/USD medium-term chart reveals a stabilizing base in the crypto-economic trade, with swing traits showing strong promise.
The stochastic oscillators’ positioning posture now has it that buying forces are steadily building up on a recouping threshold, signaling renewed strength and momentum recovery. The Bollinger Bands indicators have shrunk downward tightly, affirming the strong probability of volatility compression and keeping a sustained sideways trading pattern around $0.00055, though traders should be alert for a bullish breakout if compression holds.
Will WSM/USD Sustain Investor Confidence as Stabilization and Swing Traits Signal Extended Upward Momentum Potential?
The WSM/USD market may sustain investor confidence as stabilization and swing traits align, supporting steady valuations while leaving room for buyers to exploit potential upward momentum opportunities.
The WSM market, holding a supportive structure against the pushing stances of the US dollar, reflects ongoing stabilization as swing traits reinforce investor confidence. With steady valuations sustaining a favorable environment, the convergence of signals positions buyers to harness upward momentum and drive strengthened near-term performance.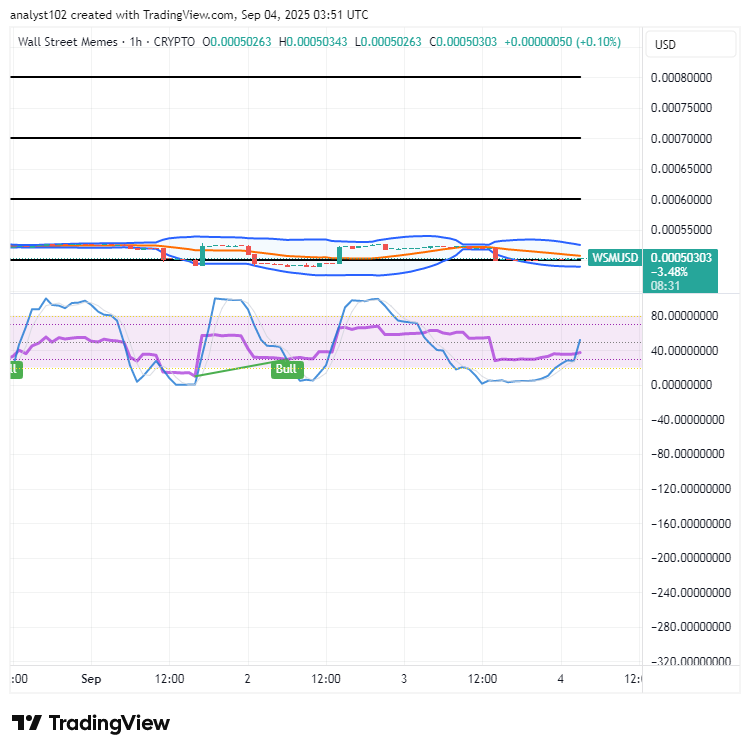
WSM/USD 1-hour chart
The 1-hour chart of the WSM/USD market shows that crypto-economic activity is stabilizing, with swing traits appearing steadily.
The stochastic oscillators maintain a repositioning pattern, swerving through variant points that highlight a bullish signal bias. Meanwhile, the Bollinger Bands have slightly expanded, embodying bargaining pressures and order flows between the $0.00055 and $0.0005 levels, suggesting potential buildup toward directional momentum.
ONLY A FEW DAYS LEFT UNTIL A HUGE $1M BUYBACK WRAPS UP! 🔥
$WSM 🚀
Grab Your Spot Now ➡️
[http://bit.ly/Twitter\_WSM\_BUY](http://bit.ly/Twitter_WSM_BUY)
4 DAYS TO GO UNTIL A MASSIVE $1M OF BUYBACKS IS COMPLETED! 🔥
— Wall Street Memes (@wallstmemes) October 7, 2023
🚀 $WSM 🚀
Buy Now ➡️ https://t.co/ffr2clEknx pic.twitter.com/pOrhialttd