Wall Street Memes (WSM) Price Holds Basis, Swing Features
Estimated Reading Time: 3 minutes
Don’t invest unless you’re prepared to lose all the money you invest. This is a high-risk investment and you are unlikely to be protected if something goes wrong. Take 2 minutes to learn more
Wall Street Memes Price Prediction – September 3
It is currently recorded that a significantly lower value has been achieved in the wake of tending to secure an all-time low, given that the WSM/USD market holds a basis firmly, making swinging features in its settings.
The Wall Street Memes market holds a basis firmly against the US dollar, making swinging features in its settings, while the Bollinger Bands stretch outward to reflect heightened volatility, encouraging tactical entries for momentum traders even as the broader trend awaits fuller confirmation.
WSM/USD Market
Key Levels
Resistance levels: $0.0007, $0.0008, $0.0009
Support levels: $0.0005, $0.0004, $0.0003
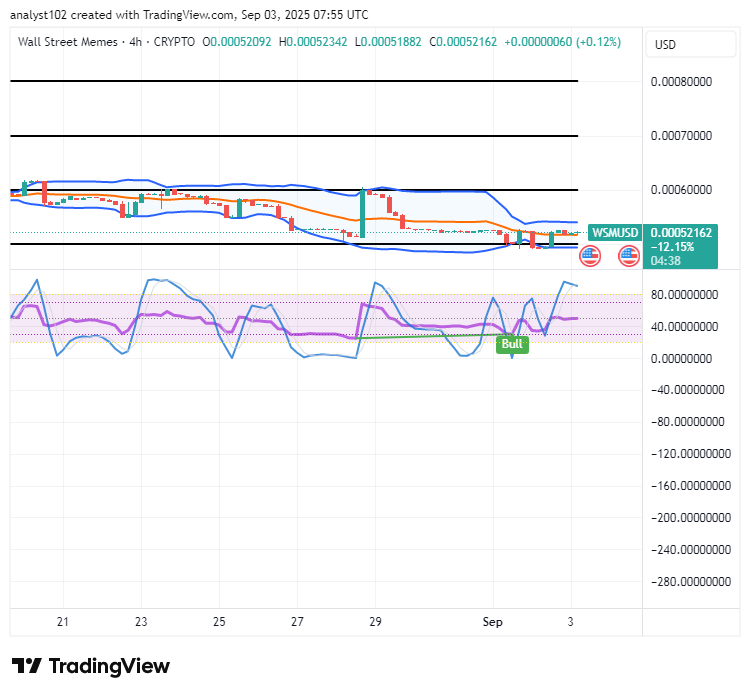
WSM/USD – 4-hour Chart
The WSM/USD medium-term chart showcases that the base crypto-economic market holds a basis, as the price’s swinging mode features steadily.
The Bollinger Bands indicators have shrunk downward, affirming the probability of keeping a sideways pattern around $0.00055. The stochastic oscillators have been maintaining a stable northward-swerving style in the formation of bullish signal notes.
Could the WSM/USD Market Sustain Its Strong Basis as Market Swings Project Positive Promissory Signs?
The WSM/USD market’s business shows resilience with its firm basis, yet traders should remain cautious, as positive swing signs may still face resistance before establishing stronger confirmation.
The WSM/USD market traders should remain cautious, as swing signs may still face resistance before stronger confirmation. Bollinger Band expansions highlight volatility, suggesting opportunities for tactical swings if consolidation strengthens confidence. Longer-term stability hinges on liquidity inflows and sustained buyer participation, warranting cautious optimism.
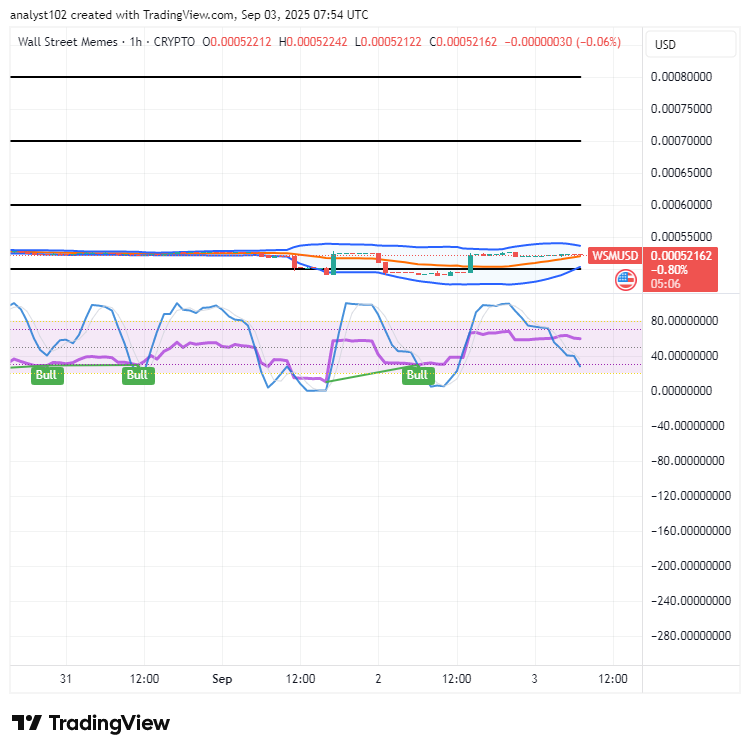
WSM/USD 1-hour chart
The 1-hour chart of the WSM/USD market showcases that crypto-economic business holds the basis strongly, given that its market’s swing features positive promissory signs.
The Bollinger Bands are now slightly opened to embody bargaining orders between the points of $0.00055 and $0.0005. As of the time of this piece, the stochastic oscillators are gradually edging toward the oversold region, signaling the potentiality of getting to see buyers gaining back stronger stances as market volatility broaden.
WSM Community, We Saw Your Tweets Loudly!
WSM /USDT Is Now Officially Tradeable on #Bybit Perpetuals Platform.
$WSM community, we saw your Tweets! 👏$WSM / $USDT is now tradeable on #Bybit Perpetuals.
— Bybit (@Bybit_Official) October 13, 2023
Trade here: https://t.co/le4XyVyXaZ
Also want your project listed? Share your suggestions here:https://t.co/W7EWJVVNV5 https://t.co/XgXoL7g0rF