DeFi Coin Price Prediction: DEFC/USD Range-bounds as More Buyers Are Expected
Estimated Reading Time: 3 minutes
Don’t invest unless you’re prepared to lose all the money you invest. This is a high-risk investment and you are unlikely to be protected if something goes wrong. Take 2 minutes to learn more

Free Crypto Signals Channel
The DeFi Coin price prediction shows that DEFC will recover to the upside as the coin gets ready for a cross above the moving averages.
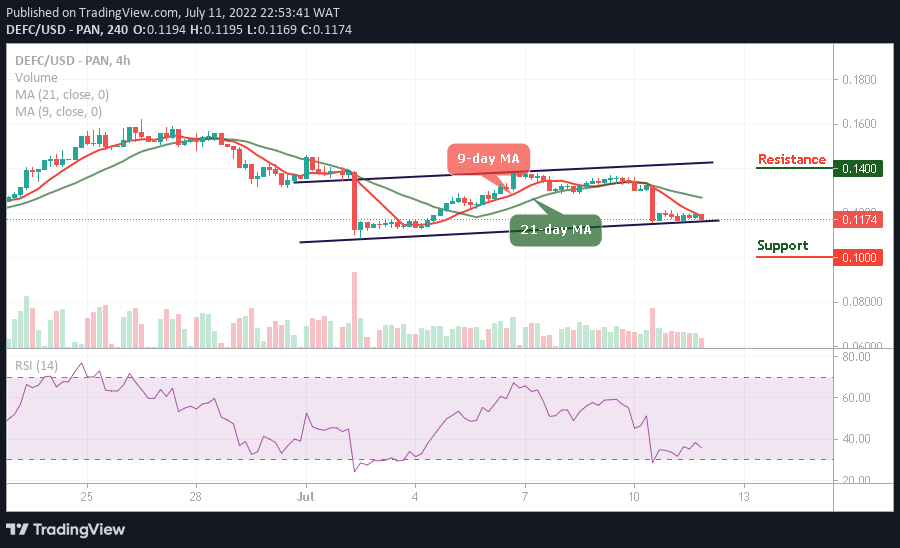
DEFC/USD Medium-term Trend: Bearish (4H Chart)
Key Levels:
Resistance levels: $0.14, $0.16, $0.18
Support levels: $0.10, $0.08, $0.06
DEFC/USD is ranging at the moment as the market price is ready to reclaim the resistance level of $0.12 above the 9-day moving average. Meanwhile, the market will become cheaper for new and existing buyers to enter the market. However, should the bulls fail to push the price upward, the DeFi Coin price may continue sideways before gaining the upside.
DeFi Coin Price Prediction: DEFC/USD Would Move Higher
As revealed by the chart, the DeFi Coin price would break towards the upper boundary of the channel if the bulls defend the $0.11 support level. However, any further bullish movement above the 9-day and 21-day moving averages will push the price to the potential resistance levels of $0.14, $0.12, and $0.16.
Nevertheless, the upward movement may be delayed if the bears stay below the moving averages to touch the low of $0.10, $0.08, and $0.06 support levels. More so, the technical indicator Relative Strength Index (14) keeps moving below 40-level to prepare for the upward movement.
DEFC/USD Medium-term Trend: Bearish (2H Chart)
According to the 2-chart, the DeFi Coin price is still consolidating within the channel. The coin is heading to the upside as the major resistance level could be located at $0.12. However, if the buyers push the price above this level, higher resistance could be located at $0.13 and above.
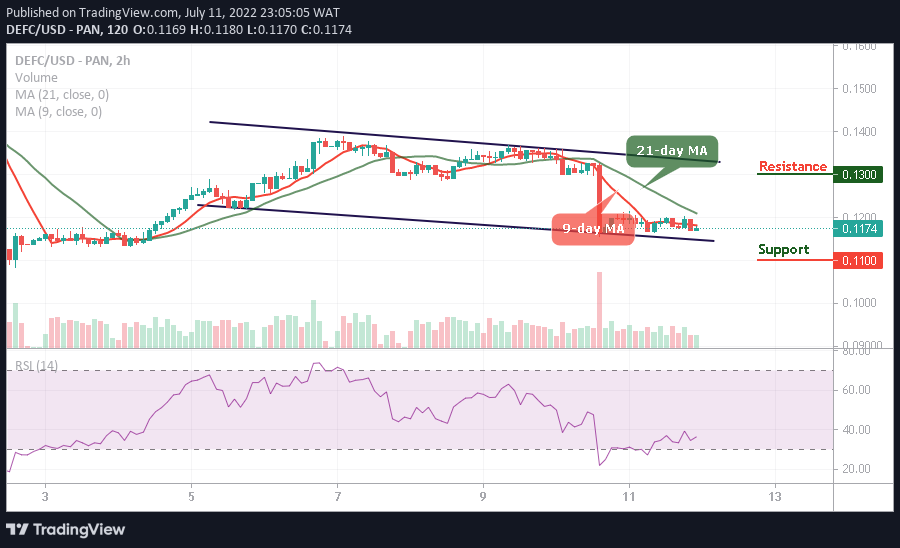
Moreover, the technical indicator Relative Strength Index (14) moves below the 40-level, indicating that bullish signals are still in play. Moreover, should the bulls fail to move the current market value above, the bears may step back into the market, and the nearest support level could be found at $0.11 and below.
You can purchase DeFi Coin here. Buy DEFC