Litecoin (LTC) Price Prediction: LTC Closes in on the $90.00 Mark
Estimated Reading Time: 3 minutes
Don’t invest unless you’re prepared to lose all the money you invest. This is a high-risk investment and you are unlikely to be protected if something goes wrong. Take 2 minutes to learn more
Litecoin (LTC) Price Prediction: May 21
Litecoin’s price movement saw a significant increase in the previous session on the daily chart. As a result, the market rose from below the $85.00 mark to trade close to the $90.00 mark. However, today’s trading reveals that the previous price movement has attracted downward pressure. How will the Bulls handle this challenge?
LTC/USDT Long-term Trend: Bullish (Daily Chart)
Resistance Levels: $100.00, $110.00, and $120.00
Support Levels: $80.00, $70.00, and $60.00
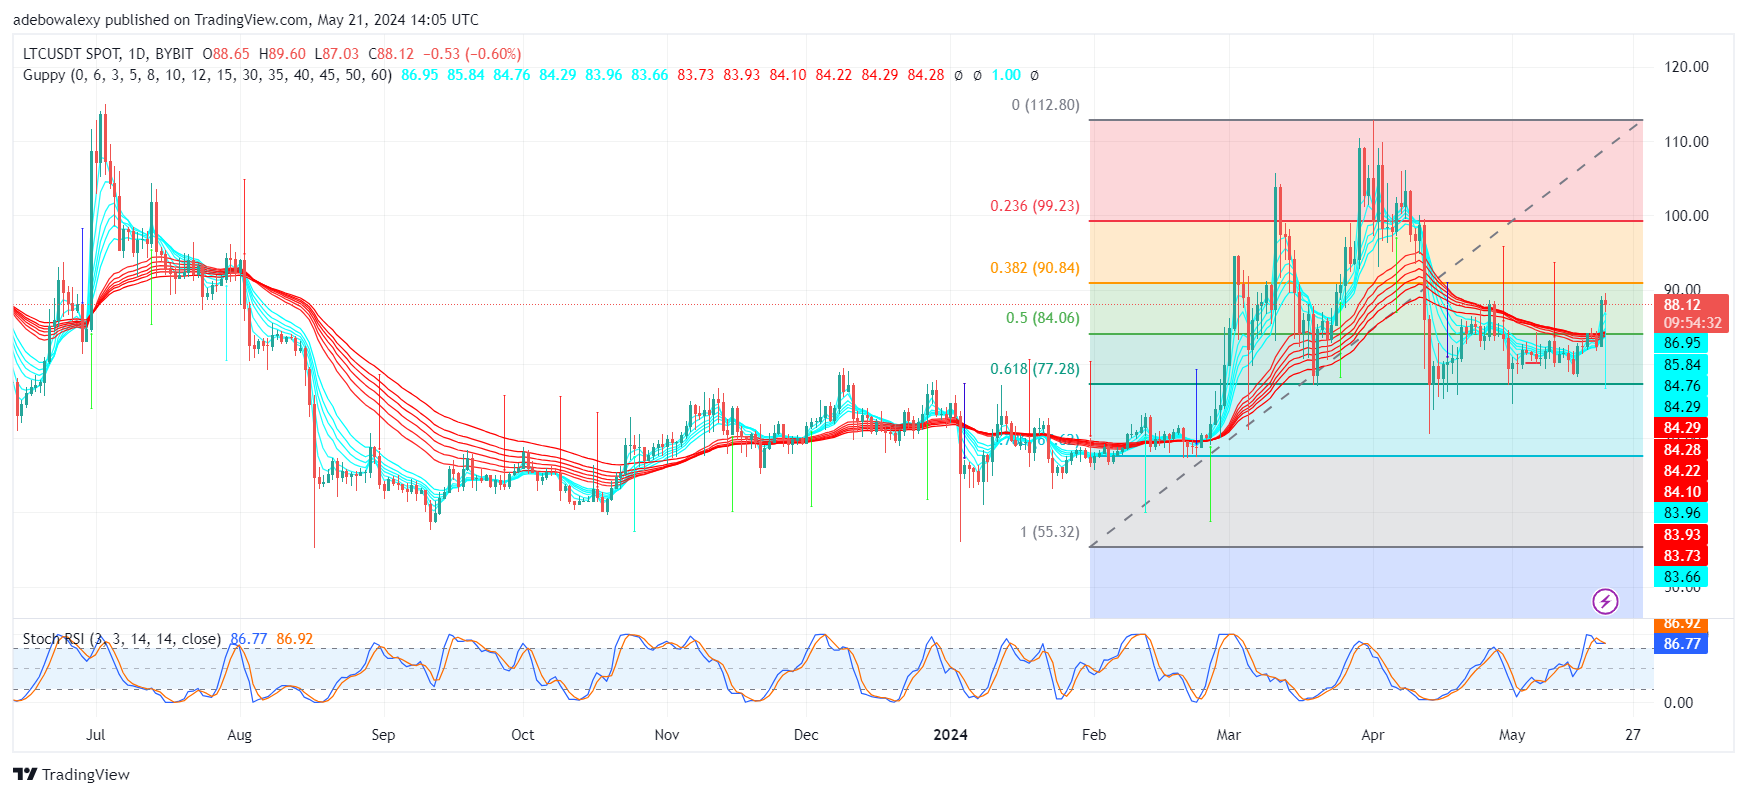
Price action in the LTC daily market has risen past the Guppy Multiple Moving Average (GMMA) lines in the previous session. However, today’s session has faced challenges from headwinds, restricting further price increases. Meanwhile, the Stochastic Relative Strength Index (SRSI) lines are now in the overbought region. In response to the rejection, the SRSI lines have started to trend downward and are converging for a crossover.
Litecoin Price Prediction: Can an Upside Trend Continuation Result?
In response to the above question about the Litecoin daily market, one might suggest that the market has a fair chance to continue upwards. Trading activities are occurring above the GMMA lines, implying that the prevalent trend in the market is an upward one.
However, the appearance of a red price candle for the current session suggests that headwinds have created resistance around the $88.00 mark. Nonetheless, the convergence of the SRSI lines offers hope for an upside continuation in this market, suggesting that LTC might soon charge through the $90.00 mark.
LTC/USDT Medium-term Trend: Upside Hopes Seem Threatened in the Litecoin Market (4H Chart)
Similar to the daily chart, LTC continues to trade mostly above the GMMA lines. However, the last price candle on this chart has just brought the price of the token below the first GMMA line. Meanwhile, the lines of the Moving Average Convergence Divergence (MACD) indicator have risen above the equilibrium level.
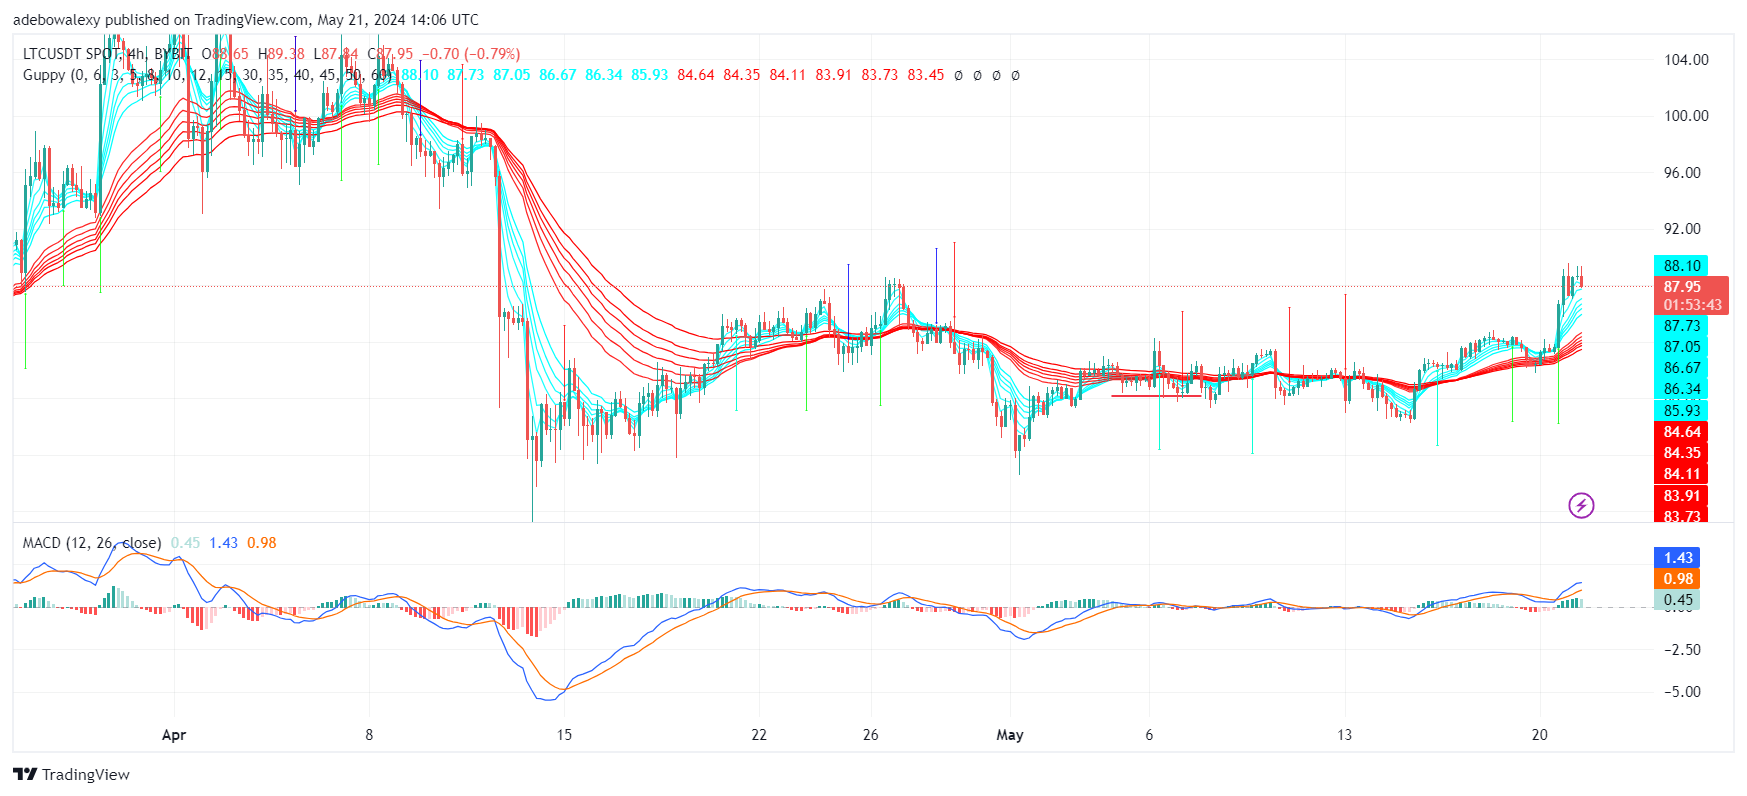
Although the leading line of the indicator appears slightly deflected, the general trajectory remains upward. At this point, upside anticipation still seems plausible, given that the prevailing market force is upward. Therefore, it is more likely that the market will break the $90 mark and approach the $100 price mark.