Quant Price Prediction: QNT/USD Establishes a Low Under $150 as Price Ready for a Spike
Estimated Reading Time: 3 minutes
Don’t invest unless you’re prepared to lose all the money you invest. This is a high-risk investment and you are unlikely to be protected if something goes wrong. Take 2 minutes to learn more
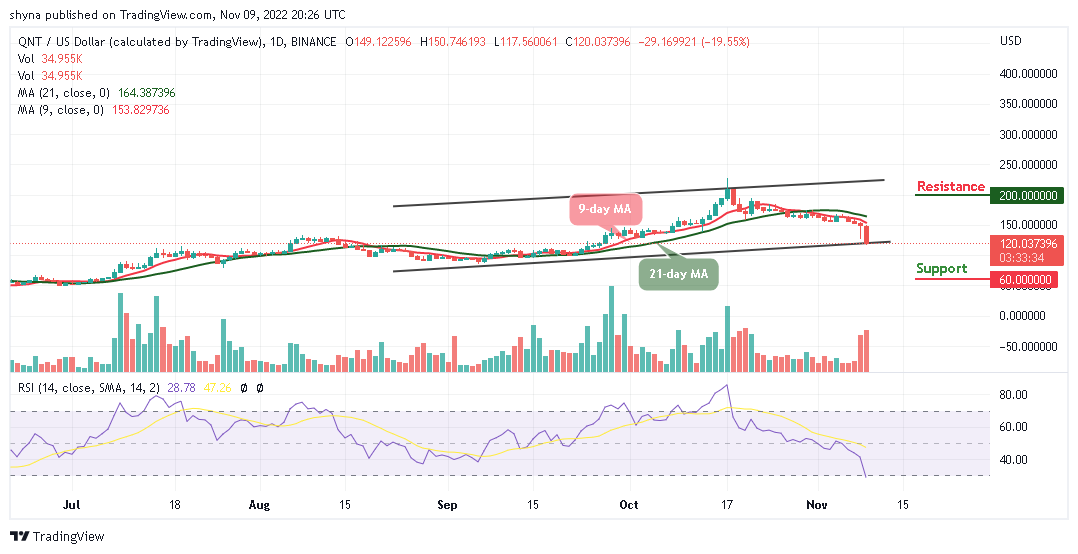
Quant Price Prediction – November 9
The Quant price consolidates underneath a $150 barrier and could be doing this for another bullish movement to the $180 level.
QNT/USD Long-term Trend: Ranging (Daily Chart)
Key levels:
Resistance Levels: $200, $220, $240
Support Levels: $60, $40, $20
QNT/USD today touches the daily high of $150 before heading to the downside. During this period, the Quant price is now facing down by 19.55% in value. It is likely to retain this bearish vibe in the near term as the technical indicator Relative Strength Index (14) could move into the oversold region, shifting focus from the upside. At the time of writing, the price of Quant is hovering at $120.
Quant Price Prediction: QNT Price Ready to Push Higher Again
According to the daily chart, if the Quant price gains more downsides, the nearest support at $115 may be tested to the downside as the price consolidates. Failure of the noted support could see the Quant price sliding below the lower boundary of the channel. More so, this area is likely to slow down the correction and could serve as a jumping-off ground for another recovery attempt; therefore, if it is out of the way, the support level of $60, $40, and $20 may come into play.
In the meantime, QNT/USD is still fighting to correct the subtle bearish movement, and the bullish trend coupled with the right volume and high volatility level is the right ingredient for the recovery to $160. This could be necessary for the coin to resume its upward movement toward the resistance levels of $200, $220, and $240.
QNT/USD Medium-Term Trend: Bearish (4H Chart)
On the 4-Hour chart, QNT/USD is currently trading below the 9-day and 21-day moving averages as the price hovers around $120, it could take time to persistently head to the upside. In addition, the upward movement could touch the resistance levels of $145 and above if the bulls push higher again.
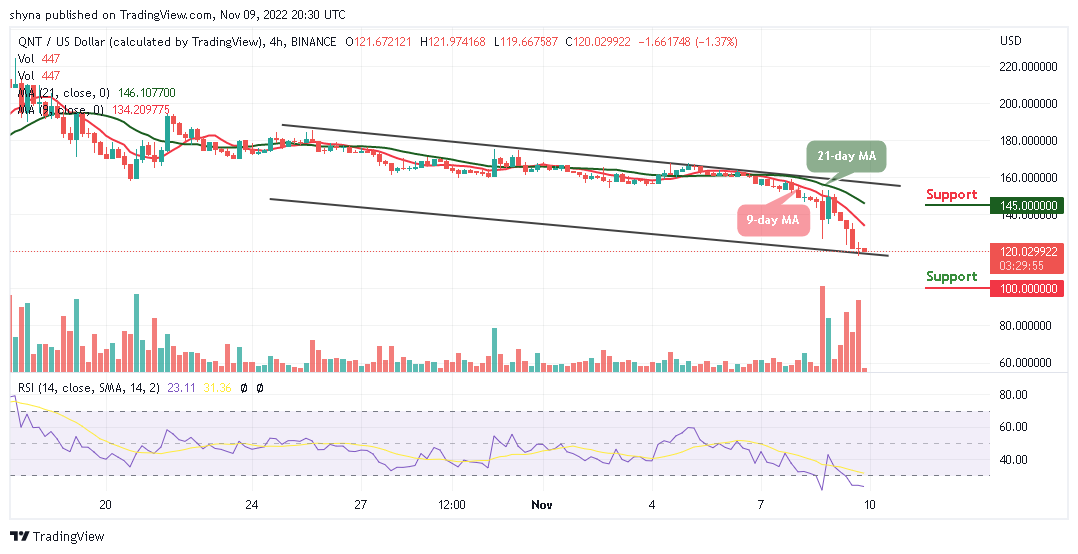
On the downside, the price could fall below the lower boundary of the channel if the bears increase the selling pressure; therefore, any further movement could test the critical support at the $100 level and below as the existing buyers and the new buyers are expected to invest more on the coin. Moreover, the Relative Strength Index (14) is still moving within the oversold region as the coin will soon follow a bullish movement.
Place winning Quant trades with us. Get QNT here