Wall Street Memes (WSM) Trade Keeps Level; Small Pullback Hits
Estimated Reading Time: 3 minutes
Don’t invest unless you’re prepared to lose all the money you invest. This is a high-risk investment and you are unlikely to be protected if something goes wrong. Take 2 minutes to learn more
Wall Street Memes Price Prediction – September 1
As the process of threshold affirmation continues in the search for an all-time low, business activities indicate that the WSM/USD trade is maintaining a formidable level, despite minor pullback pressures.
The WSM/USD trade continues to demonstrate formidable strength, holding firm against minor pullbacks with a resilient stance. This performance highlights strong market conviction and growing buyer participation, indicating that the current foundation could transform into a launch-pad for sustained bullish momentum and meaningful price appreciation.
WSM/USD Market
Key Levels
Resistance levels: $0.0007, $0.0008, $0.0009
Support levels: $0.0005, $0.0004, $0.0003
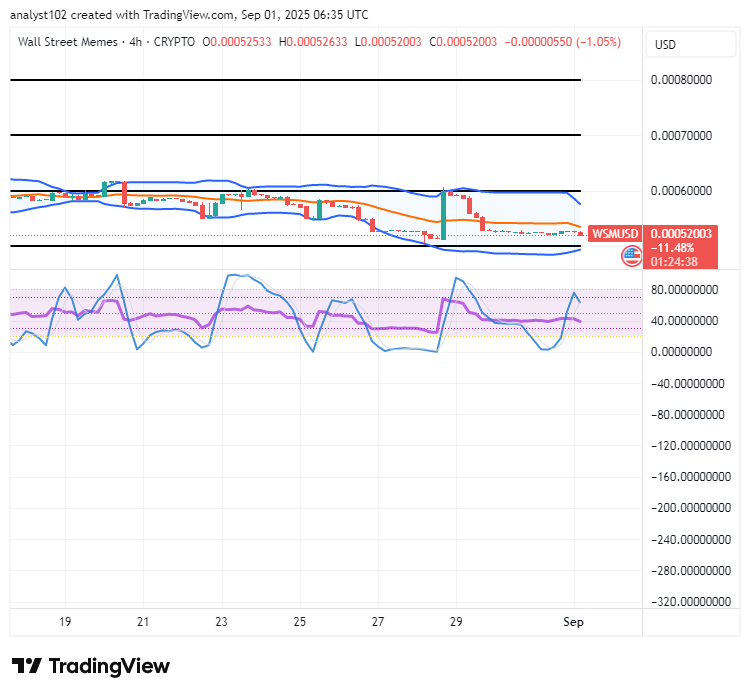
WSM/USD – 4-hour Chart
The WSM/USD medium-term chart reveals that the base crypto-economic trade keeps level; small pullback hits.
The stochastic oscillators have gone swerving northbound closely to the point of 80, signaling a mere caution against getting into fearful sudden drawbacks. The Bollinger Bands indicators are firmly positioned, signifying that trading forces are largely bordered around the middle and the lower supportive parts.
Will the Market sustain its Current Level, or do Small Pullback Hits Threaten Deeper Corrections?
The WSM/USD trade keeps level despite minor pullbacks, with supportive forces holding firm; however, traders should remain alert, as deeper corrections may emerge if momentum weakens around key support thresholds.
Traders should remain alert, as deeper corrections may emerge if momentum weakens around key support thresholds, particularly if selling pressure intensifies near lower zones, potentially triggering accelerated declines and unsettling broader market confidence moving forward.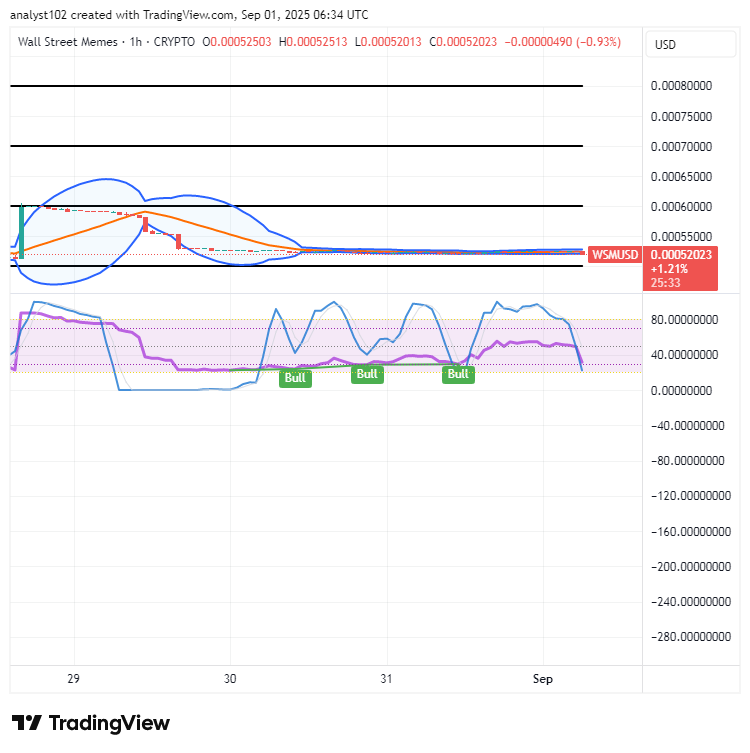
WSM/USD 1-hour chart
The 1-hour chart of the WSM/USD market showcases that crypto-economic market keeps level; small pullback hits.
The Bollinger Bands are steadily tightening into a converging pattern just below the critical $0.00055 zone, while the stochastic oscillators are gradually edging toward the oversold region, clearly signaling that a potential downside corrective move is steadily approaching with increasingly stronger momentum.
Over the past 24 hours, the $WSM token and its wider community have experienced a deliberate and coordinated cyberattack. The hackers specifically targeted our official Discord community platform.
We want to firmly reiterate that no one from the Wall St Memes core team will ever direct message you first, nor ask for any private or sensitive personal information—not even under urgent circumstances.
Hey everyone, in the past 24 hours, the WSM token and community went through a coordinated attack, with hackers specifically going after and disrupting our official Discord space.
Over the last 24 hours, The $WSM token and community has undergone a coordinated attack. The hackers specifically targeted our Discord community.
— Wall Street Memes (@wallstmemes) October 12, 2023
We reiterate that no one from the Wall St Memes team will ever direct message you first, or ask for any personal information – even… pic.twitter.com/VwySpXC7cz