The Apecoin (APE/USD) Market May Soon See a Trend Reversal
Estimated Reading Time: 2 minutes
Don’t invest unless you’re prepared to lose all the money you invest. This is a high-risk investment and you are unlikely to be protected if something goes wrong. Take 2 minutes to learn more
The APE/USD market attained the year’s all-time high at the $6.00 price level in late January. After its peak, the market embarked on a long and slow price decline that spanned over five months. The slowness of the Apecoin bear market is due to the strong presence of bulls in the market and the low volume of trade.
Apecoin Market Data
- APE/USD Price Now: $2.99
- APE/USD Market Cap: $1,150,382,792
- APE/USD Circulating Supply: 368,593,750 APE
- APE/USD Total Supply: 1,000,000,000
- APE/USD Coinmarketcap Ranking: #40
Key Levels
- Resistance: $3.5, $4.5, $5.0
- Support: $2.5, $2.0, and $1.5.
Price Prediction for Apecoin: The Indicators’ Point of View:
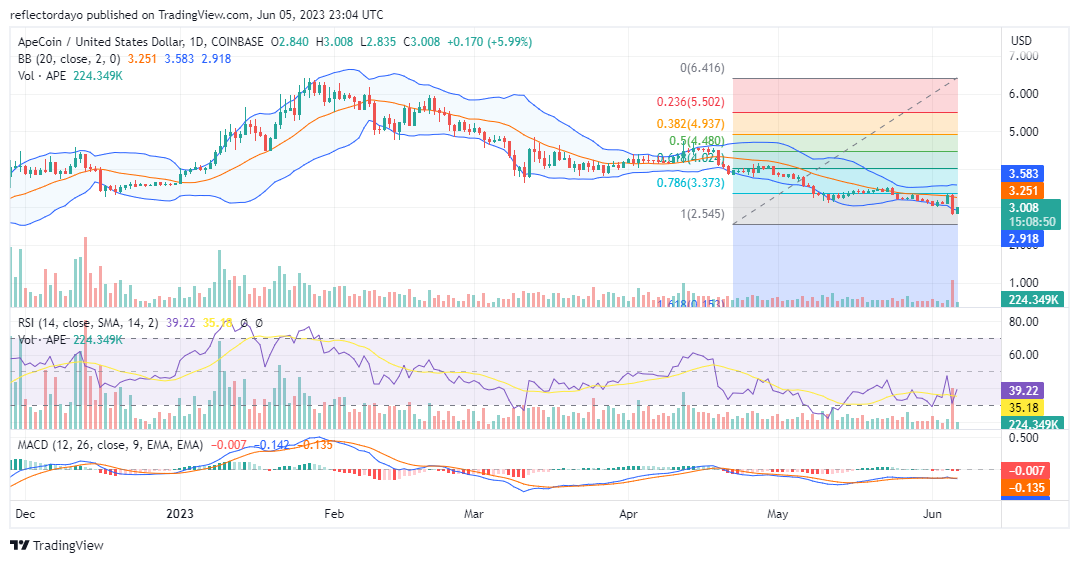
The market experienced more of a sideways-ranging market movement and a bit of a decline at some point. On each occasion when the market dropped to a lower price level, it could be said to have been caused by bullish exhaustion. Looking at the Apecoin market, each time bulls make a significant move in the market, it is usually followed by a more significant bearish move, which would make the market slide further into the demand zones. Currently, the market is near the 100% Fibonacci retracement level, and a trend reversal is expected to play out from here. Also, the Bollinger Bands indicate an increase in the volatility level; this is also another pointer to a possible trend reversal.
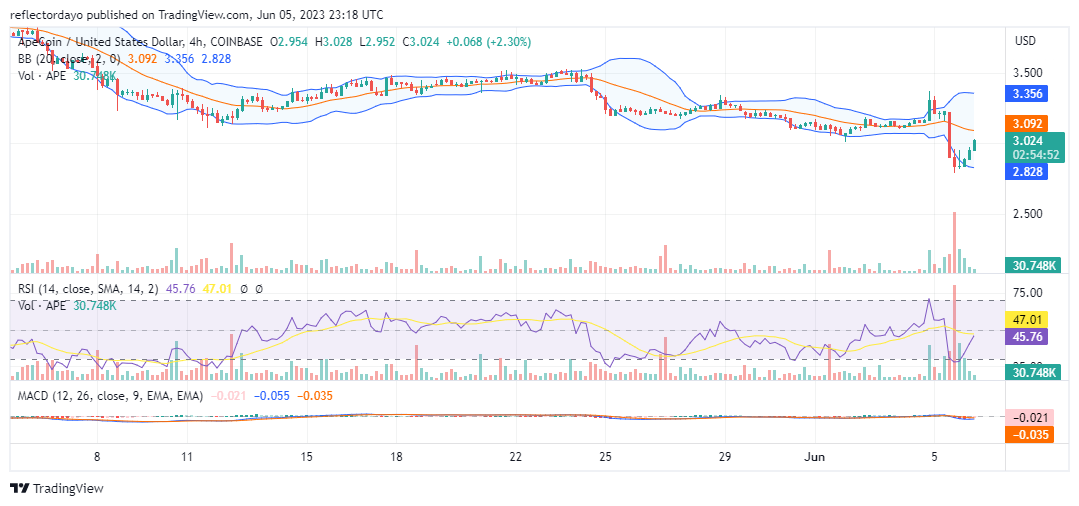
Apecoin 4-Hour Chart Outlook:
From the 4-hour timeframe, we can see the bullish recovery already playing out after the market took strong support at the $2.828 price level. The first three 4-hour sessions of today’s market are significantly dominated by buyers. The Bollinger Bands indicator still points to a high level of market volatility. However, the concern is the low volume of trade in the third trading session for today.