Wall Street Memes (WSM) Price Steady, Small Dip Seen
Estimated Reading Time: 3 minutes
Don’t invest unless you’re prepared to lose all the money you invest. This is a high-risk investment and you are unlikely to be protected if something goes wrong. Take 2 minutes to learn more

Wall Street Memes Price Prediction – August 31
As recurring trade patterns indicate that bears are still attempting to mount tentative pressure against WSM/USD market bulls, it is also observed that the price remains steady, with a minor dip appearing to set the stage for a potential rebound toward higher levels.
In addition, clear market indications suggest that the current consolidation of Wall Street Memes (WSM) against the U.S. dollar reflects less of a fundamental weakness and more of a strategic pause, as buyers steadily absorb supply, gradually build liquidity, and confidently position for stronger upside momentum.
WSM/USD Market
Key Levels
Resistance levels: $0.0007, $0.0008, $0.0009
Support levels: $0.0005, $0.0004, $0.0003
WSM/USD – 4-hour Chart
The WSM/USD medium-term chart showcases that the base crypto economy is steady, as a small dip is seen in the setup of the pairing instruments.
The Bollinger Bands indicators have now slightly go downward, settling notable trade spots between the middle and the lower trend lines. The stochastic oscillators are seen, gradually deepening in the oversold region, signaling a possible attempt of the market to witness an upsurge in no time.
Could the Recent Dip in Crypto Be a Healthy Pause Before Further Gains?
The recent dip may reflect a natural pause, as steady consolidation often precedes stronger rallies, suggesting WSM/USD market buyers are regrouping for potential upward momentum in the near term, given that a small dip is seen.
The prevailing structure, supported by Bollinger Bands compression, suggests the market is consolidating strength rather than displaying weakness, as interim pullbacks enable accumulation, improving liquidity depth and reinforcing the probability of a sustainable rebound once broader confidence re-enters the trend.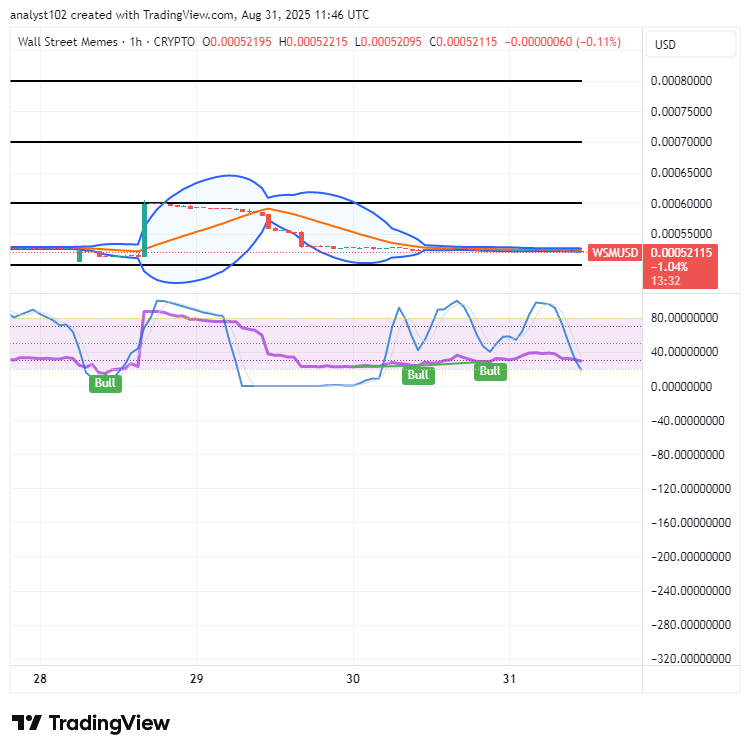
WSM/USD 1-hour chart
The 1-hour chart of the WSM/USD market showcases that crypto’s trade is steady, as a small dip is seen.
The Bollinger Bands are tightening into a converging pattern just below the $0.00055 zone, while the stochastic oscillators are gradually edging toward the oversold region, clearly signaling that a potential downside corrective move is steadily approaching.
Over the past 24 hours, the $WSM token and its wider community have experienced a deliberate and coordinated cyberattack. The hackers specifically targeted our official Discord community platform.
We want to firmly reiterate that no one from the Wall St Memes core team will ever direct message you first, nor ask for any private or sensitive personal information—not even under urgent circumstances.
Over the last 24 hours, The $WSM token and community has undergone a coordinated attack. The hackers specifically targeted our Discord community.
— Wall Street Memes (@wallstmemes) October 12, 2023
We reiterate that no one from the Wall St Memes team will ever direct message you first, or ask for any personal information – even… pic.twitter.com/VwySpXC7cz