Decentraland (MANA/USD) Seeks Stability Above $0.32
Estimated Reading Time: 2 minutes
Don’t invest unless you’re prepared to lose all the money you invest. This is a high-risk investment and you are unlikely to be protected if something goes wrong. Take 2 minutes to learn more

Decentraland has successfully broken above the $0.32 level and is currently holding steady above this threshold. This bullish move suggests that the $0.32 zone could potentially flip into a support level. If a correction occurs, the market may test this price point, and its ability to hold could confirm $0.32 as a solid support base for further upward momentum.
Decentraland (MANA/USD) Market Data
- MANA/USD Price Now: $0.327
- MANA/USD Market Cap: $647 million
- MANA/USD Circulating Supply: 1.96 billion MANA
- MANA/USD Total Supply: 2.19 billion MANA
- MANA/USD CoinMarketCap Ranking: #108
Key Levels
- Resistance: $0.33, $0.34, and $0.35
- Support: $0.30, $0.25, and $0.20
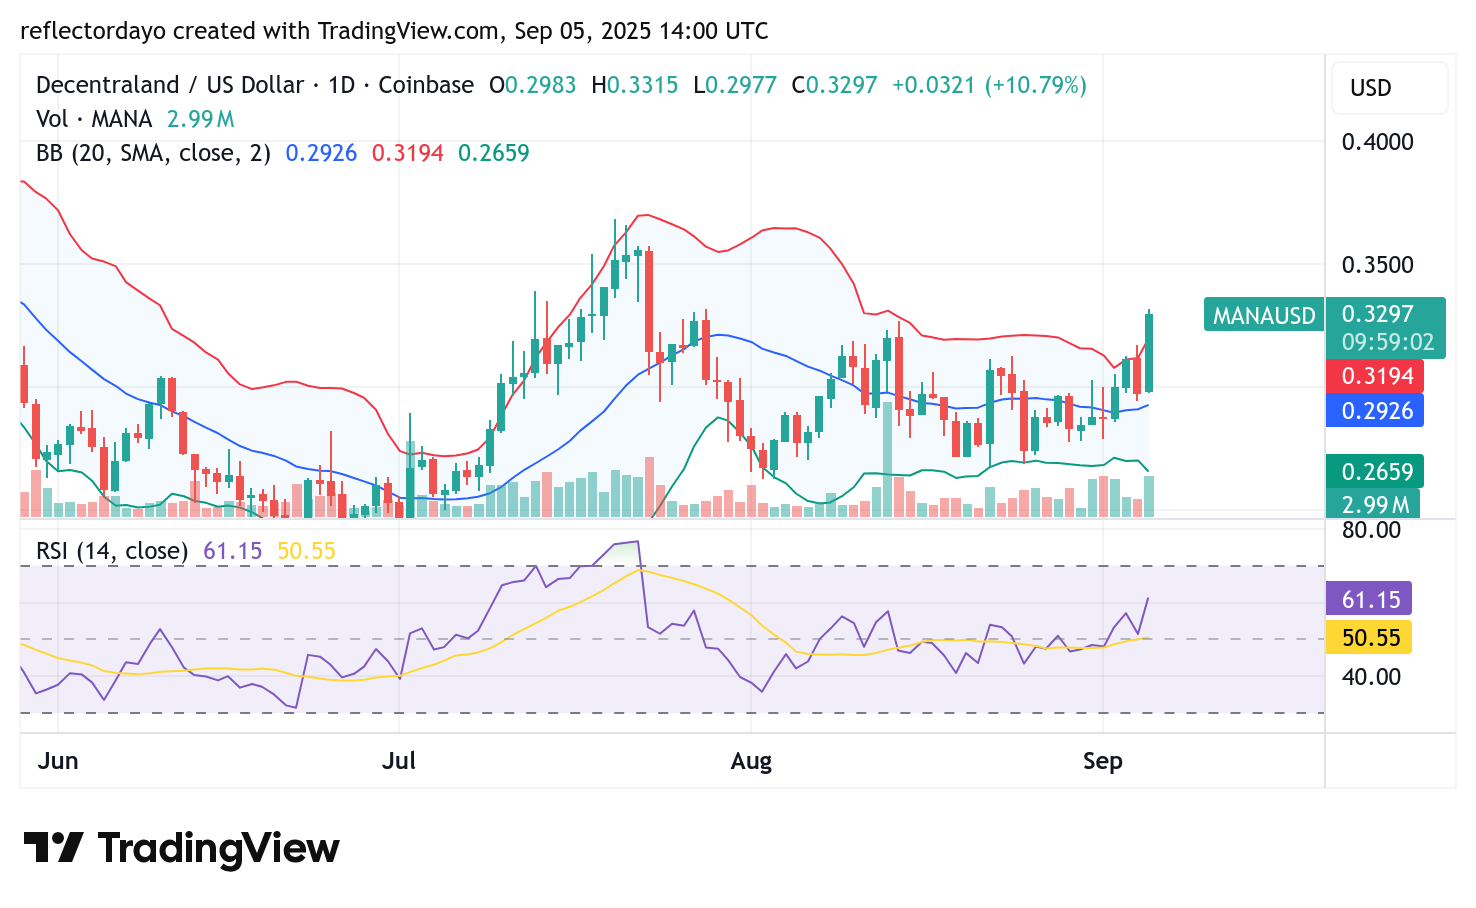
Decentraland (MANA/USD) Daily Chart Outlook
Throughout much of August, Decentraland traded within a consolidation range, a phase that preceded the bearish correction following its peak at the $0.37 level. The market experienced heightened volatility during this period, with bearish pressure at $0.30 proving too weak to withstand bullish momentum. As a result, resistance shifted to $0.32, which has now been breached amid strong buying interest driving the current daily session.
It is worth noting that the Bollinger Bands are widening, signaling increased crypto market volatility. This expansion suggests that price swings could intensify around key levels. Overall, indicators point to strong participation and sustained interest from traders, reinforcing the bullish outlook for Decentraland.

MANA/USD 4-Hour Chart Analysis
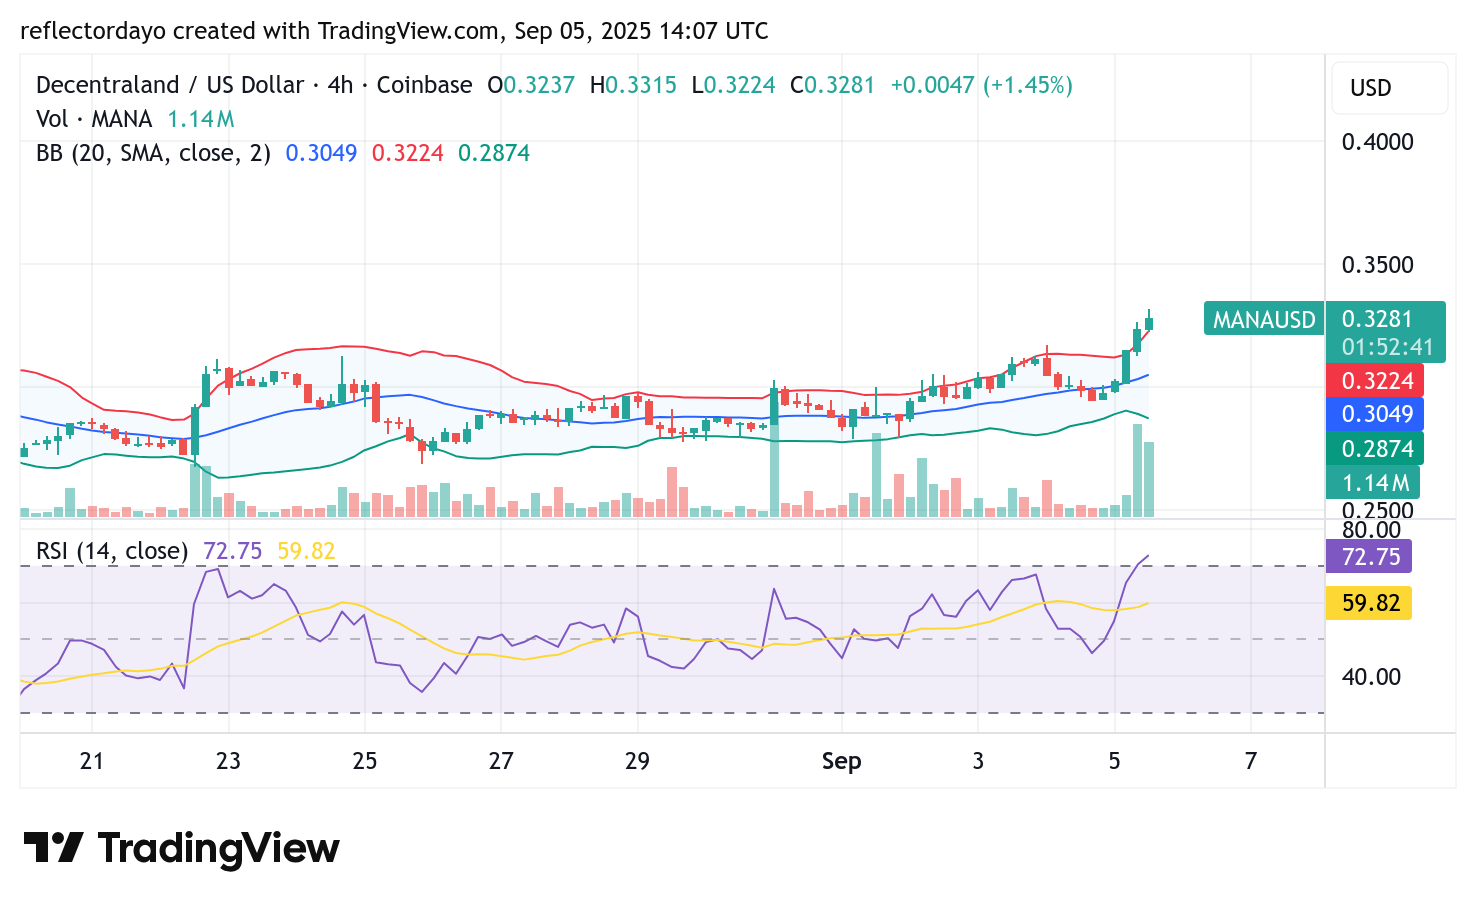
From the 4-hour chart perspective, bullish interest in the market is steadily increasing. The Bollinger Bands are expanding, reflecting upward momentum and signaling growing volatility in favor of the bulls. The last two trading sessions also highlight strong buying activity, as traders continue to push prices higher.
However, the market remains vulnerable to a notable correction, with the $0.33 level standing out as a key resistance that could temporarily cap further advances.