Bancor (BNTUSD) Hit $2.820 With a Pullback and Expansion Tactics in an Ascending Channel
Estimated Reading Time: 3 minutes
Don’t invest unless you’re prepared to lose all the money you invest. This is a high-risk investment and you are unlikely to be protected if something goes wrong. Take 2 minutes to learn more

Free Crypto Signals Channel
Bancor Analysis – BNTUSD Uses Pull Back and Expansion Tactics in an Ascending Channel to Hit $2.820
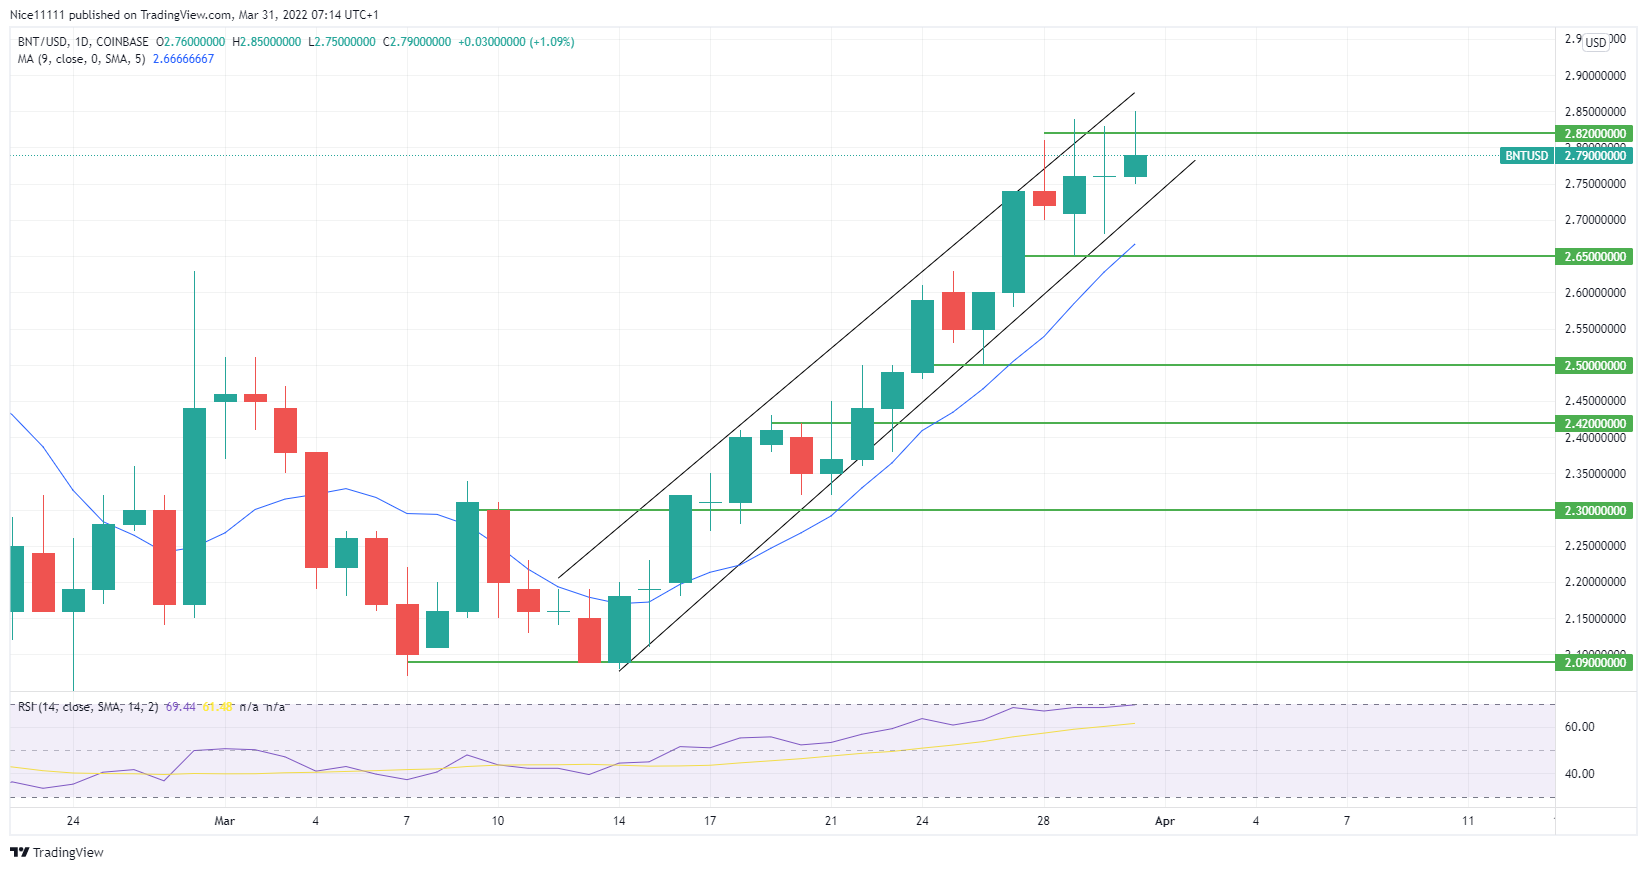
BNTUSD hit $2.820 with a pullback and expansion tactics in the ascending channel. The market has been very bullish. From the 14th of March, when the bull run was initiated, till the 31st of March, there have only been three down days. Every new day is seen to surpass the previous days’ open. The 26th of March was slightly different because the close of the day was almost equal to the previous day’s open. Consistently, the previous day’s highs were cleaned and surpassed by the next day.
Key Zones on BNTUSD
Demand Zone: $2.090, $2.500, $2.650
Supply Zone: $2.820, $2.420, $2.300
The BNTUSD pullback and expansion tactics have aided the market trend. The market initially pulled back to the $2.090 demand zone to initiate the bull run. The buyers utilized the zone to go long in the market. The price rose to clear the previous high on the daily chart, formed on March 10th, 2022. Upon reaching $2.420, the market pulled back on the 20th of March. The retracement increased the buying momentum. Another pullback occurred on March 25th, 2022. The market tapped into the demand zone at $2.500 the next day.
The retracement to $2.500 caused a pullback and expansion to reach the resistance at $2.800. Before the resistance zone was reached, a pullback was initiated on the 28th of March. The open of the next day till the low of the next day completed the pullback into the demand zone. From the 16th of March until the current day, the Moving Average Period nine has rested below the close of the daily candles. The price action on the daily timeframe has formed an ascending channel.

What to Expect From BNTUSD?
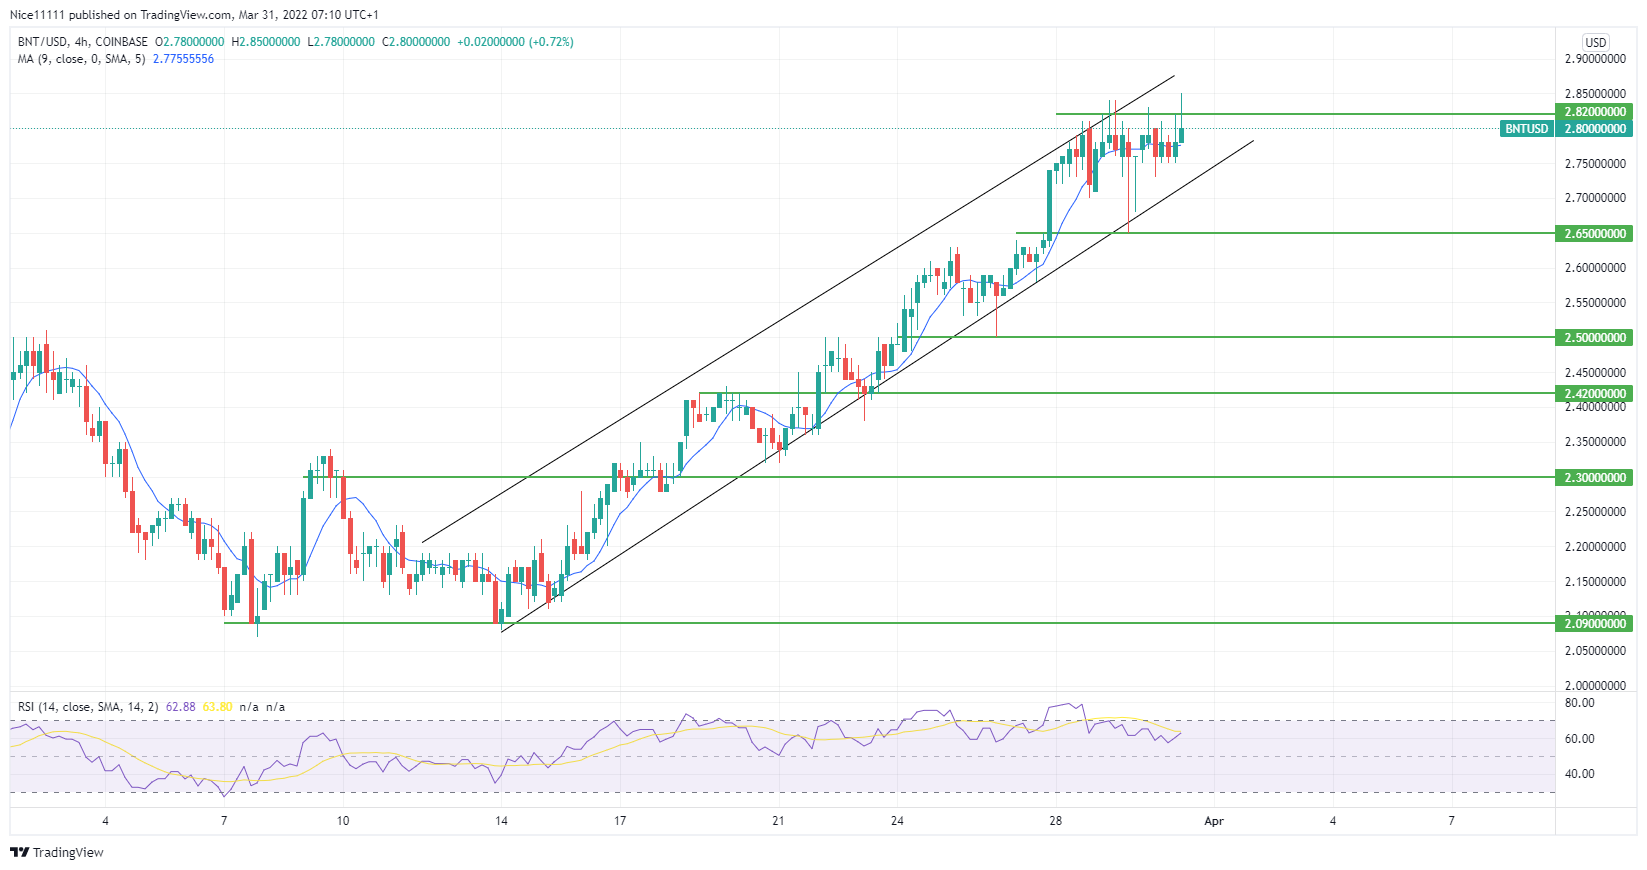
The market is currently being seen as overbought by the RSI indicator on the daily chart. On the four-hour chart, the RSI is close to the overbought region. A break of the demand zone at $2.650 will likely cause a total reversal. Currently, the market’s direction still seems to be unchanging. Therefore, the market is likely to return to the base of the ascending channel. This is expected to gather momentum to break resistance at $2.820.
How To Buy Lucky Block
Note: Cryptosignals.org is not a financial advisor. Do your research before investing your funds in any financial asset or presented product or event. We are not responsible for your investing results.