Arbitrum Price Prediction: ARB/USD Briefly Falls Below $1.66; Is that all for Bulls?
Don’t invest unless you’re prepared to lose all the money you invest. This is a high-risk investment and you are unlikely to be protected if something goes wrong. Take 2 minutes to learn more

Arbitrum Price Prediction – December 28
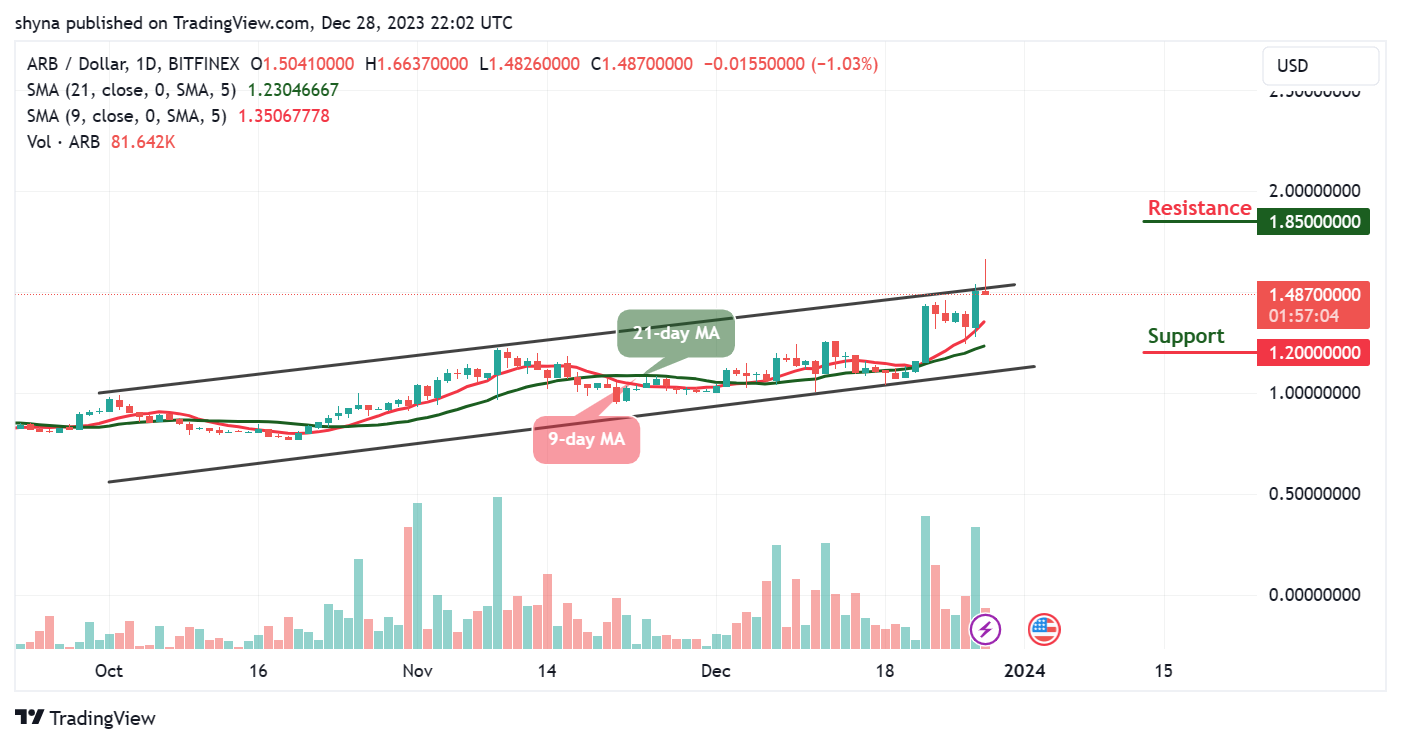
Arbitrum price prediction is now showing signs of market correction as its price slides below $1.66 to touch the low of $1.48.
ARB/USD Long-term Trend: Bullish (Daily Chart)
Key levels:
Resistance Levels: $1.85, $1.95, $2.05
Support Levels: $1.20, $1.10, $1.00

ARB/USD is trading around $1.48 above the 9-day and 21-day moving averages. Despite the retracement, Arbitrum (ARB) has remained in a bullish zone and it is likely to continue lower toward $1.70. The coin is now plunging below the former resistance level of $1.50 which may cause many investors to take profits off the table.
Arbitrum Price Prediction: Would Arbitrum (ARB) Go Up or Down?
The Arbitrum price is currently changing hands at $1.48, however, where ARB trends next may partly depend on whether or not buyers can close today’s candle above the $1.50 level. Should in case this come into play, it may propel prices higher and then traders may expect ARB/USD to rise above $1.70 resistance which could later move towards the potential resistance levels at $1.85, $1.95, and $2.05.
On the other hand, if the Arbitrum price failed to close above the channel; the price could drop below the 9-day and 21-day moving averages. A further low drive could send the price to $1.20, $1.10, and $1.00 supports. Meanwhile, the 9-day moving average remains above the 21-day moving average showing a possible bullish movement within the channel.
ARB/USD Medium-term Trend: Ranging (4H Chart)
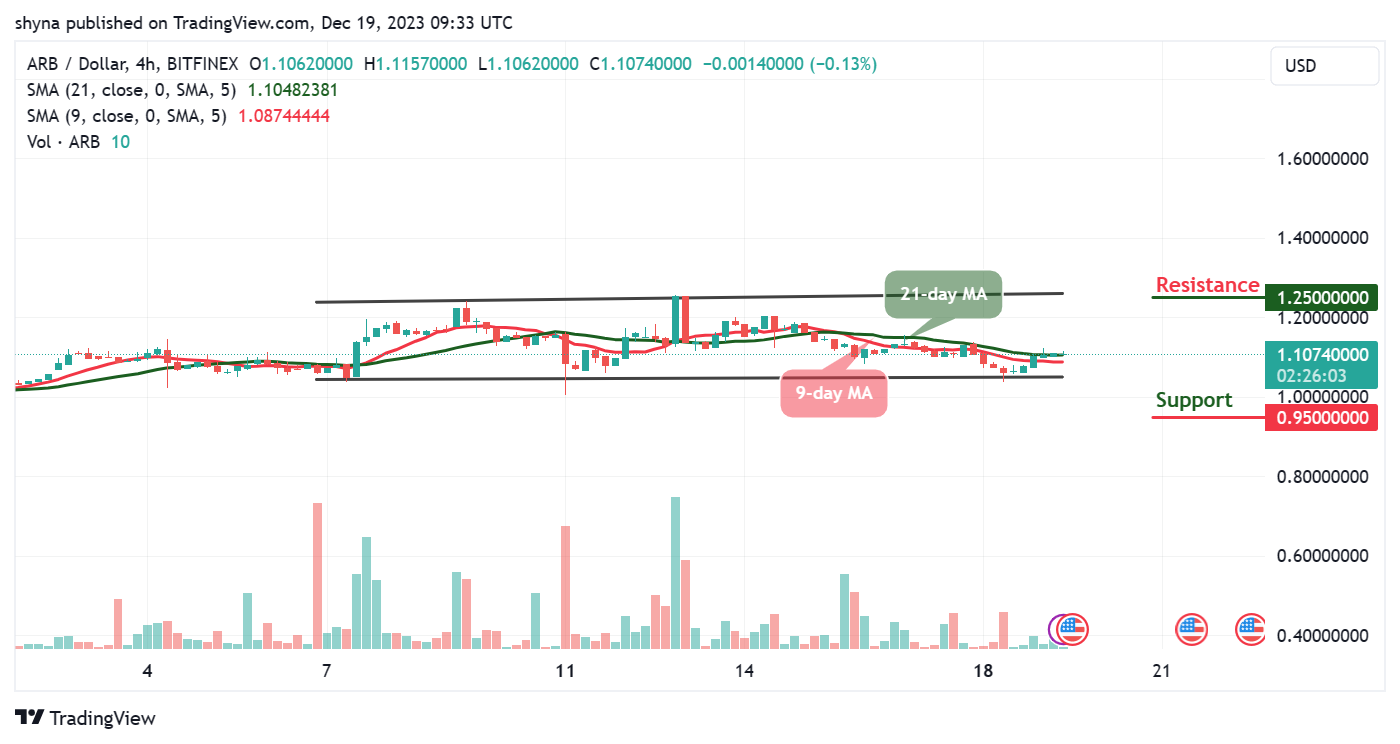
Looking at the 4-hour chart, following the rejection of $1.50, the Arbitrum price is hovering below the 9-day moving average. Looking at it from above, if the Arbitrum holds above $1.50, then the next level of resistance could be $1.60. The next resistance level could be found at $1.85 and above.

Meanwhile, if the coin slid below the 21-day moving average, this might have signaled a temporary end to the bullish trend of Arbitrum for a moment. However, any further bearish movement below the lower boundary of the channel may locate the support level at $1.10 and above.
Place winning Arbitrum trades with us. Get ARB here


