Arbitrum Price Prediction: ARB/USD Consolidates Around $1.107
Estimated Reading Time: 3 minutes
Don’t invest unless you’re prepared to lose all the money you invest. This is a high-risk investment and you are unlikely to be protected if something goes wrong. Take 2 minutes to learn more
Arbitrum Price Prediction – December 19
The Arbitrum price continues to consolidate underneath the moving averages and on top of critical support at $1.100.
ARB/USD Long-term Trend: Ranging (Daily Chart)
Key levels:
Resistance Levels: $1.30, $1.40, $1.50
Support Levels: $0.90, $0.80, $0.70
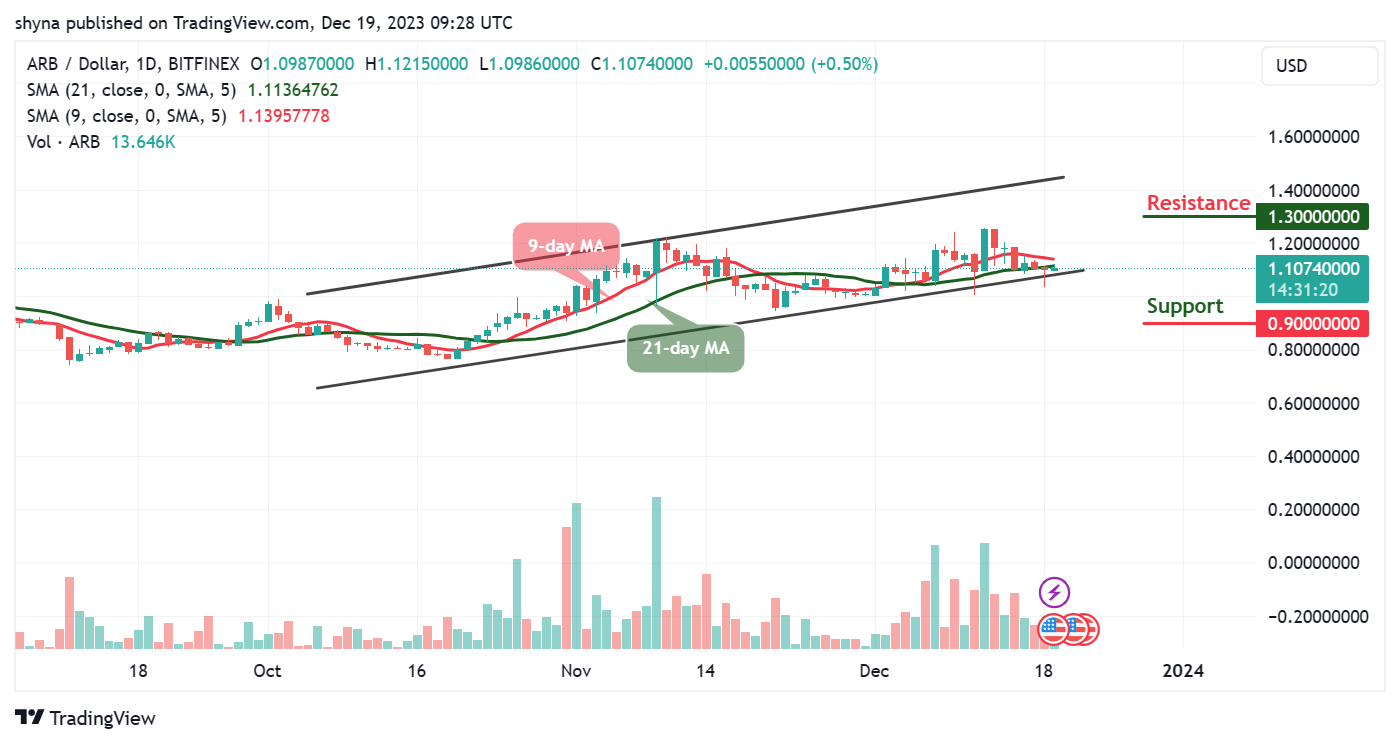
ARB/USD today touched the daily high of $1.121 before trading at $1.10. During this period, the Arbitrum price is now facing up by 0.50% in value. It is likely to retain the bullish movement in the near term as the 9-day moving average remains above the 21-day moving average, shifting focus to the upside. At the time of writing, the price of Arbitrum is likely to cross above the moving averages.
Arbitrum Price Prediction: ARB Ready to Push Higher?
Looking at the daily chart, there’s potential for the Arbitrum price to surpass both the 9-day and 21-day moving averages, initiating an upward trajectory. However, it’s crucial to monitor the critical support at $1.09, as it may be tested during price consolidation. Therefore, a breach of this support level could lead to the Arbitrum price falling below the lower boundary of the channel. On the contrary, if the market conditions favor the sellers, attention may shift to support levels at $0.90, $0.80, and $0.70.
At the moment, the Arbitrum price stands at $1.10, amidst a growing bullish momentum, actively combating a subtle bearish trend. However, the ongoing bullish momentum, combined with appropriate volume and heightened volatility, creates an optimal environment for a potential recovery toward the resistance level of $1.20. Meanwhile, this recovery could pave the way for a resumption of the upward movement targeting resistance levels at $1.30, $1.40, and $1.50.
ARB/USD Medium-term Trend: Ranging (4H Chart)
Looking at the 4-hour chart, the Arbitrum price is currently trading around the 21-day moving average. The Arbitrum price is hovering around $1.10 and may take time to trade above this level. However, the upward movement may likely touch the resistance levels of $1.25 and above if the bulls regroup again.
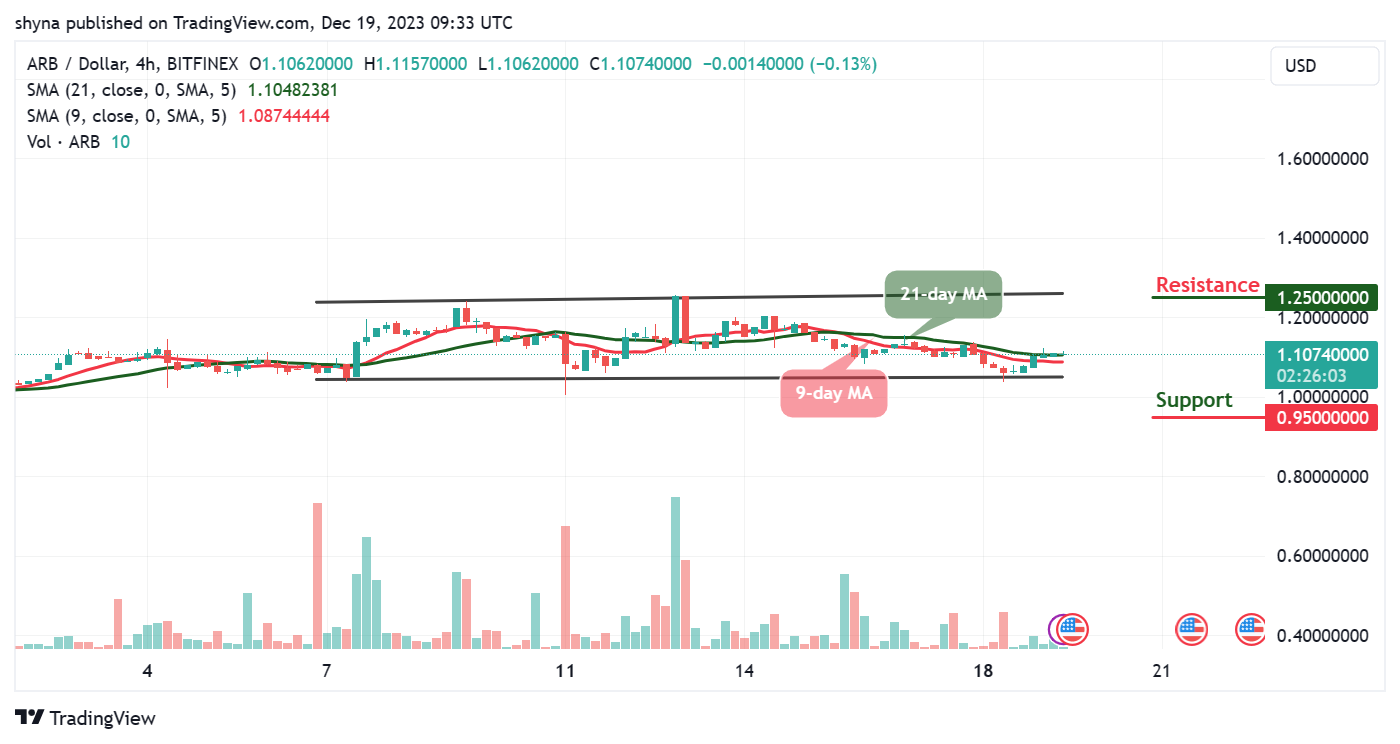
Meanwhile, on the downside, the price could fall below the lower boundary of the channel if the bears resume back to the market; any further bearish movement could test the critical support at the $0.95 level and below. In addition, the 9-day moving average remains below the 21-day moving average, indicating a bearish movement.
Place winning Arbitrum trades with us. Get ARB here