Arbitrum Price Prediction: ARB/USD Could Hit $1.20 Level
Estimated Reading Time: 3 minutes
Don’t invest unless you’re prepared to lose all the money you invest. This is a high-risk investment and you are unlikely to be protected if something goes wrong. Take 2 minutes to learn more
Arbitrum Price Prediction – December 7
The Arbitrum price prediction shows that ARB moves close to the resistance level of $1.20 within the channel.
ARB/USD Long-term Trend: Ranging (Daily Chart)
Key levels:
Resistance Levels: $1.35, $1.40, $1.45
Support Levels: $0.90, $0.85, $0.80
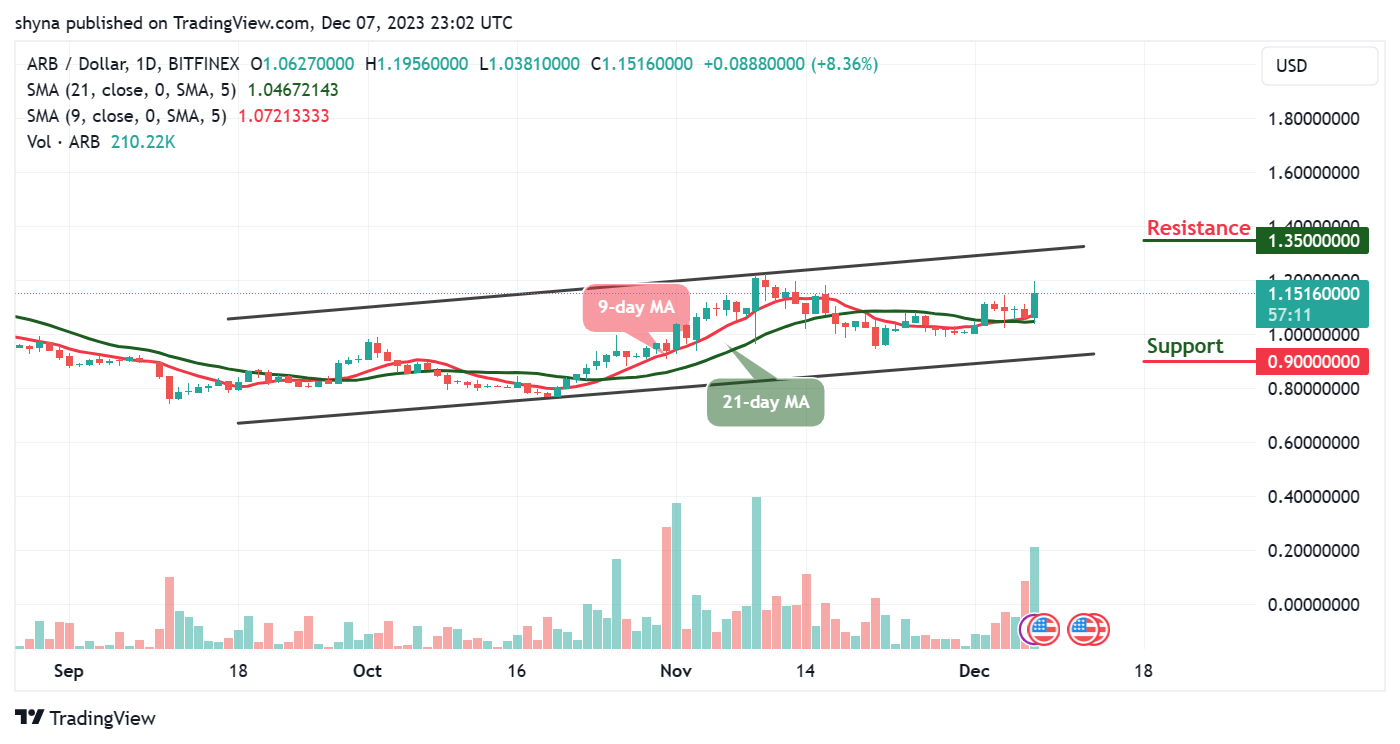
ARB/USD is currently trading around $1.15 with an 8.36% gain after the daily low at $1.03. According to the daily chart, the Arbitrum price may continue to fight to stay above the important level of $1.10 as it could move toward the upper boundary of the channel. However, for ARB/USD to remain above this barrier for the next few days, the bulls need to make the $1.00 support level to be strong.
Arbitrum Price Prediction: Arbitrum (ARB) May Spike Higher
At the time of writing, the Arbitrum price is seen moving above the 9-day and 21-day moving averages, and if it breaks above the upper boundary of the channel, ARB/USD could touch the nearest resistance level of $1.30. Moreover, the coin needs to claim this important resistance level to head to the upside.
However, looking at the moving averages, the 9-day MA may remain above the 21-day MA, but the recovery may not come easy, and traders must be aware that support will have to be sorted above $1.30 while other important levels could be located at $1.35, $1.40, and $1.45 resistance levels. Meanwhile, if the slides toward the lower boundary of the channel, the supports at $0.90, $0.85, and $0.80 may likely come to focus.
ARB/USD Medium-term Trend: Ranging (4H Chart)
On the 4-hour chart, the 9-day MA keeps hovering above the 21-day MA, and may likely spike to the north to begin an upward movement. However, the chart reveals that there is little retracement within the market as the technical indicator faces the upside.
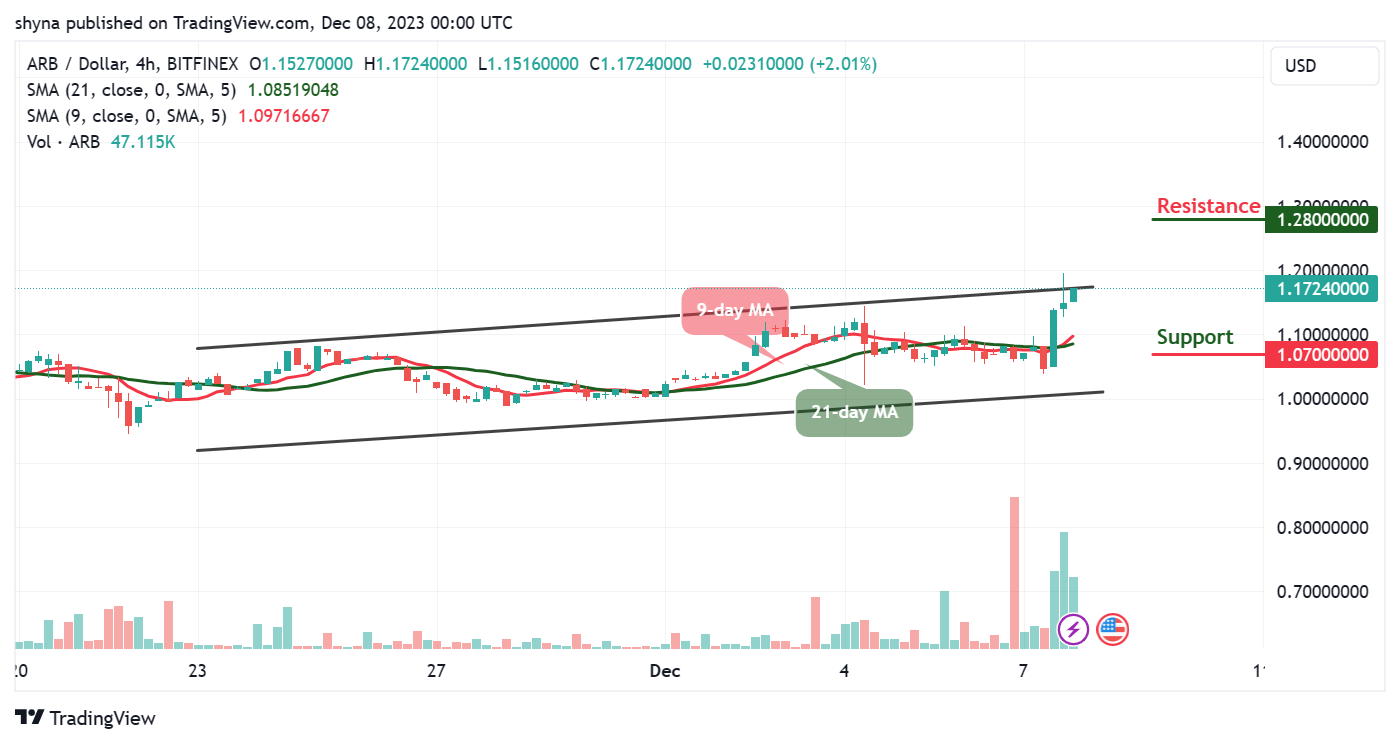
Nevertheless, if the Arbitrum price breaks above the upper boundary of the channel, it is likely for the market price to reach the potential resistance at $1.28 and above. On the contrary, if the current market value drops below the 9-day and 21-day moving averages, it may touch the support at $1.07 and below.
Place winning Arbitrum trades with us. Get ARB here