Arbitrum Price Prediction: ARB/USD Turns Bearish Below $1.00 Level
Estimated Reading Time: 3 minutes
Don’t invest unless you’re prepared to lose all the money you invest. This is a high-risk investment and you are unlikely to be protected if something goes wrong. Take 2 minutes to learn more
Arbitrum Price Prediction – November 30
The Arbitrum price prediction extends the bearish movement to the areas marginally below $1.00 after numerous trials.
ARB/USD Long-term Trend: Ranging (Daily Chart)
Key levels:
Resistance Levels: $1.25, $1.30, $1.35
Support Levels: $0.80, $0.75, $0.70
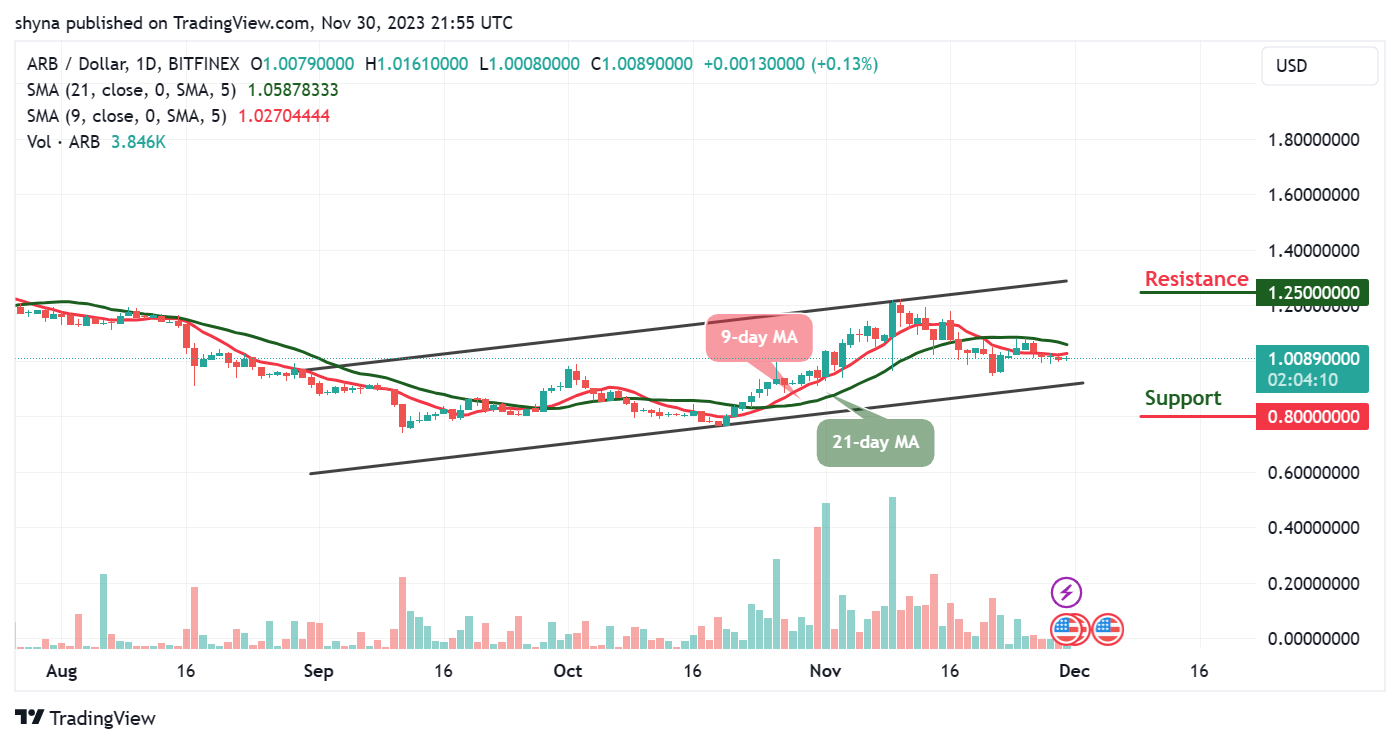
ARB/USD slides toward $1.02 as the coin experiences a support-smashing exercise after failing to hold above $1.01 following a significant breakout in the last few hours. Therefore, the bearish control is seen in some of the markets with other major digital assets posting losses as they trade below the 9-day and 21-day moving average.
Arbitrum Price Prediction: Arbitrum (ARB) May Increase the Bearish Movement
The Arbitrum price is hovering at $1.00 with a slight gain of 0.13%. According to the daily chart, the current trend is ranging with expanding volatility, and the coin is likely to consolidate in a bearish flag pattern. Meanwhile, a breakdown below the 9-day moving average may continue in the direction of the previous trend. In this case, ARB/USD is expected to drop and stay below to hit the critical support levels at $0.80, $0.75, and $0.70.
However, should the Arbitrum price head toward the upper boundary of the channel; the price could rise to $1.20 vital resistance. A further bullish drive could push the price to $1.25, $1.30, and $1.35 resistance levels. The 9-day moving average is revealing a continuous bearish, which shows that the market may follow the downside.
ARB/USD Medium-term Trend: Ranging (4H Chart)
At the opening of the market today, the Arbitrum price keeps hovering within the 9-day and 21-day moving averages to continue the sideways movement, bringing its price to trade around $1.00. Meanwhile, should the price slide toward the lower boundary of the channel, it could reach the support level at $0.92 and below.
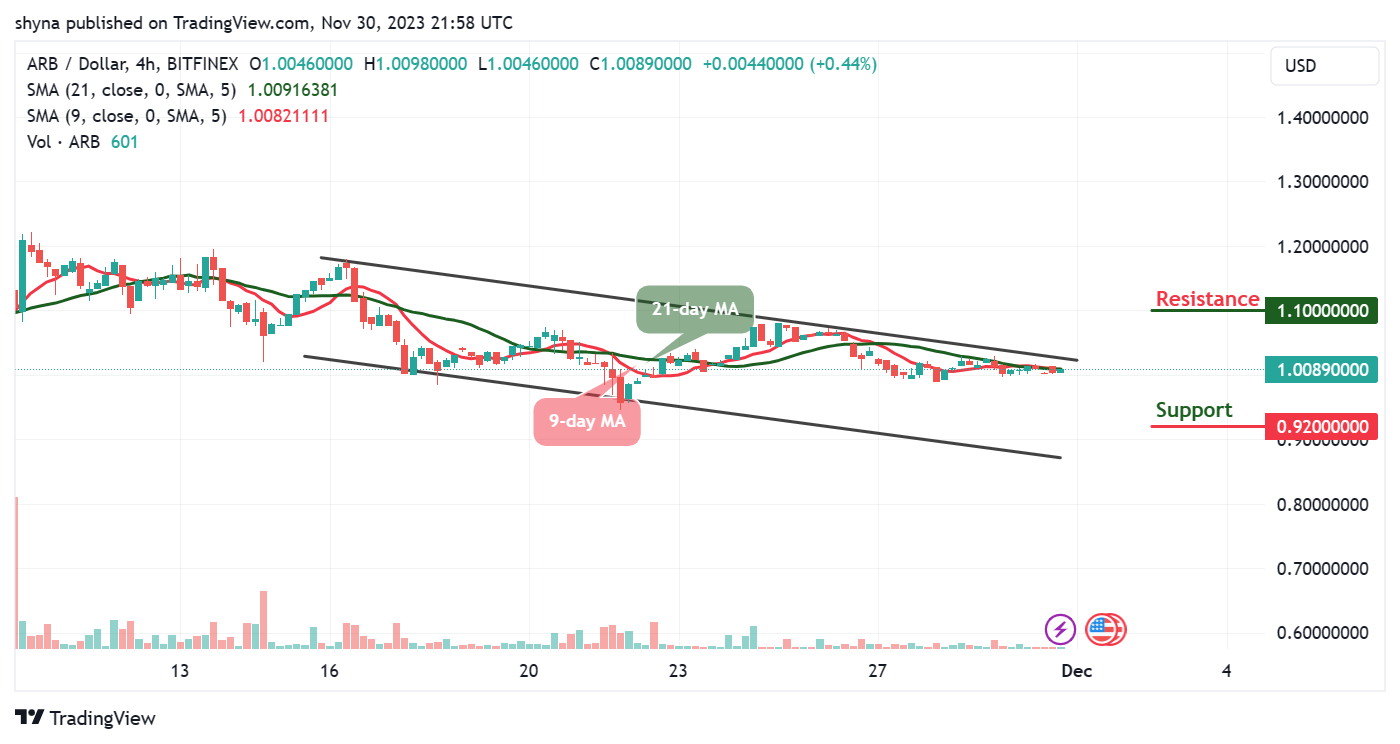
Moreover, if the bulls push the coin above the upper boundary of the channel, the Arbitrum price could hit the resistance level of $1.10 and above. Now, the market may spike to the upside or experience another downtrend if the 9-day MA crosses below the 21-day MA.
Place winning Arbitrum trades with us. Get ARB here