Arbitrum Price Prediction: ARB/USD Retreats Below the $1.05 Level
Estimated Reading Time: 2 minutes
Don’t invest unless you’re prepared to lose all the money you invest. This is a high-risk investment and you are unlikely to be protected if something goes wrong. Take 2 minutes to learn more
Arbitrum Price Prediction – November 21
The Arbitrum price prediction reveals that ARB slides to the north, the market price may touch the $0.95 support.
ARB/USD Medium-term Trend: Ranging (1D Chart)
Key Levels:
Resistance levels: $1.25, $1.30, $1.35
Support levels: $0.75, $0.70, $0.65
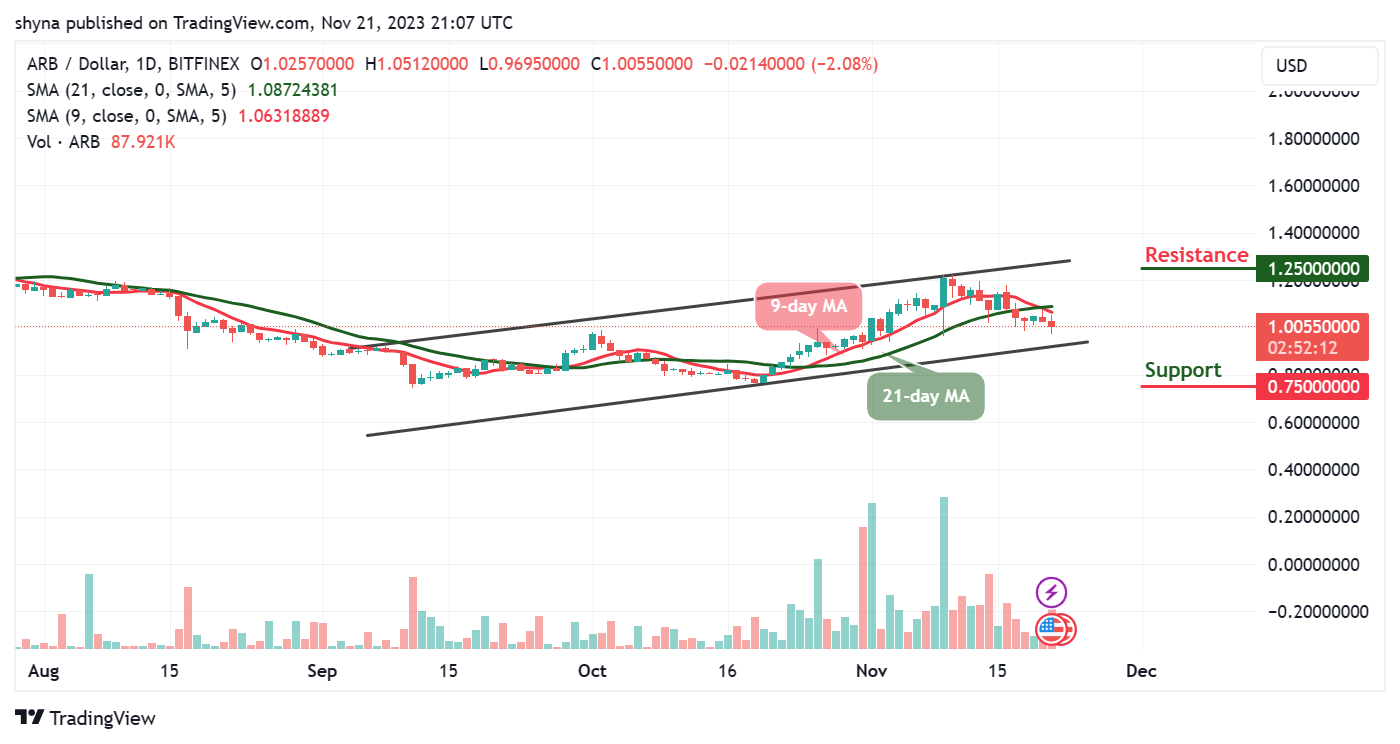
ARB/USD is facing the south as the coin moves below the 9-day and 21-day moving averages. However, if the bulls can gather enough momentum, it could make the coin move toward the $1.10 resistance level. Meanwhile, if the bulls fail to drive the price to the upside, the Arbitrum price could retreat before heading to the upside.
Arbitrum Price Prediction: ARB/USD Prepares for the Bullish Movement
The Arbitrum price is hovering at $1.005 where it is preparing for a bullish movement. The Arbitrum price may cross above the 9-day and 21-day moving averages to locate the potential resistance levels at $1.25, $1.30, and $1.35 before crossing above the upper boundary of the channel. On the contrary, crossing below the lower boundary of the channel can hit the support levels at $0.75, $0.70, and $0.65 respectively.
ARB/USD Medium-term Trend: Bearish (4H Chart)
The Arbitrum price is seen hovering below the 9-day and 21-day moving averages as the 9-day MA crosses below the 21-day MA. This is for the buyers to prepare for the upward movement, and this could be the best time for more buyers to buy the dip. However, any bullish movement above the moving averages could push the coin toward the upper boundary of the channel to hit the resistance level at $1.10 and above.
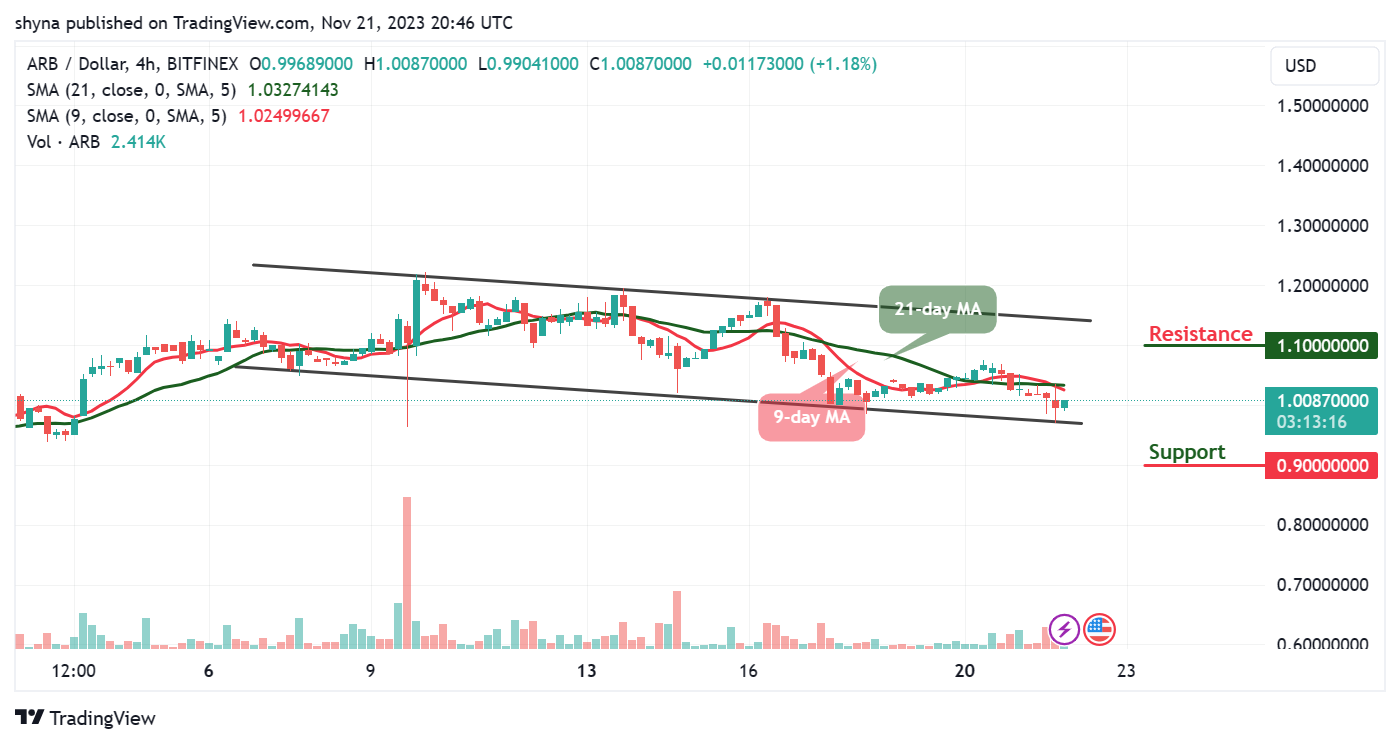
Meanwhile, the Arbitrum price can display a few bearish signals if the market price crosses below the lower boundary of the channel where it can hit the critical support at $0.90 and below. Notwithstanding the movement of the coin, the best time to buy is now as the bulls will begin to push the coin to the upside.
Place winning Arbitrum trades with us. Get ARB here