Bitcoin Cash (BCH/USD) Initiates an Upside Movement
Estimated Reading Time: 3 minutes
Don’t invest unless you’re prepared to lose all the money you invest. This is a high-risk investment and you are unlikely to be protected if something goes wrong. Take 2 minutes to learn more
After reaching a peak above $320 on June 30th, Bitcoin Cash entered a bear market phase. Although the bear market gained momentum, its pace slowed down during the second half of July, leading to market consolidation around the $240 price level, driven by strong bullish sentiment. However, this bullish sentiment lacked the strength required to reverse the market’s direction.
The demand level shifted to a lower point due to relentless selling pressure within the market, causing it to move down to $223. At this level, it appears that the support is resilient enough to provide a solid foundation for the bulls to initiate a market rally. This can be attributed to the presence of a slightly higher support level at $228.
Bitcoin Cash Market Data
- BCH/USD Price Now: $234
- BCH/USD Market Cap: $4,560,832,297
- BCH/USD Circulating Supply: 19,476,863 BCH
- BCH/USD Total Supply: 19,476,863 BCH
- BCH/USD CoinMarketCap Ranking: #18
Key Levels
- Resistance: $250, $300, and $350.
- Support: $200, $150, and $100.
Price Prediction for Bitcoin Cash: The Indicators’ Point of View
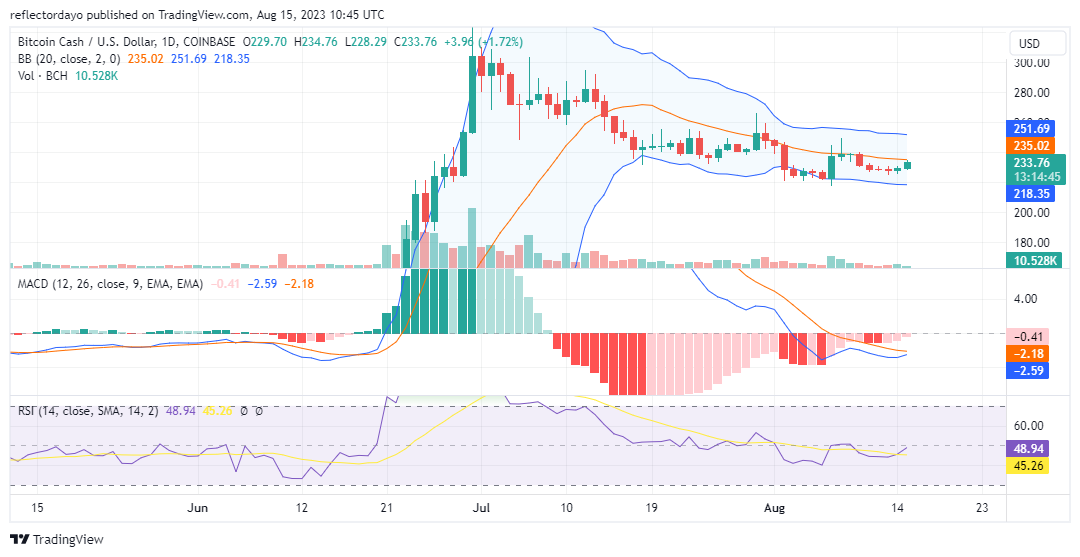
As the Bitcoin Cash market stages a rally from a higher support level, it is likely to encounter the $240 price level, which was once a support level but now acts as a resistance level. At present, the bullish candlestick representing today’s trading activities appears promising, as the price has even aligned with the 20-day moving average. However, to confirm the bullish recovery, the price must breach the $240 resistance level.
The Moving Average Convergence and Divergence (MACD) indicator also signals that the bull market is gaining momentum. A bullish crossover is imminent below the zero level, and the negative histograms are gradually transitioning toward the positive side. The current market concern pertains to the low trading volume, which could potentially hinder the pace of the recovery process.
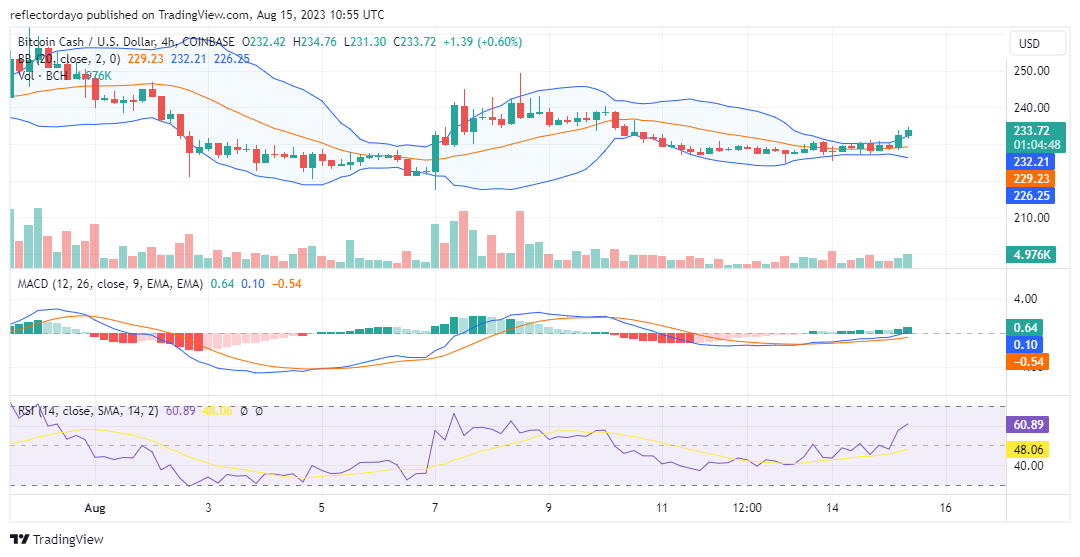
BCH/USD 4-Hour Chart Outlook
Looking at the 4-hour timeframe outlook, there is evidence of a bullish price breakout. As per the Bollinger Bands indicator, the recent market development is leading to a dual effect, resulting in an elevation of volatility. The Bollinger Bands are expanding, indicating a rise in market volatility. This scenario favors the bulls, provided they can sustain their advantage within the market. If they manage to do so, the market might aim for the $250 price level as the next target.