Cardano Oscillates In A Range As It Approaches The Chart’s Bottom
Estimated Reading Time: 2 minutes
Don’t invest unless you’re prepared to lose all the money you invest. This is a high-risk investment and you are unlikely to be protected if something goes wrong. Take 2 minutes to learn more

Cardano (ADA) Price Long-Term Forecast: Bearish
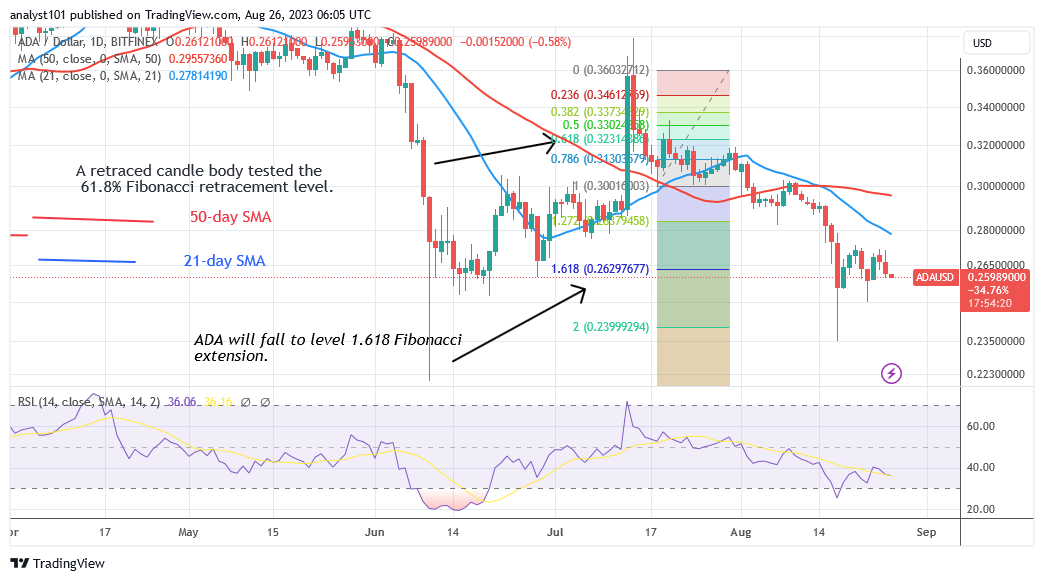
Cardano (ADA) price has returned to the historical price level of December 29, 2022 as it approaches the chart’s bottom. On August 17, the altcoin fell to a low of $0.23 before recovering. As the market approaches the bottom of the chart, the present drop has slowed. The extended candlestick tail implies strong purchasing at lower price levels.
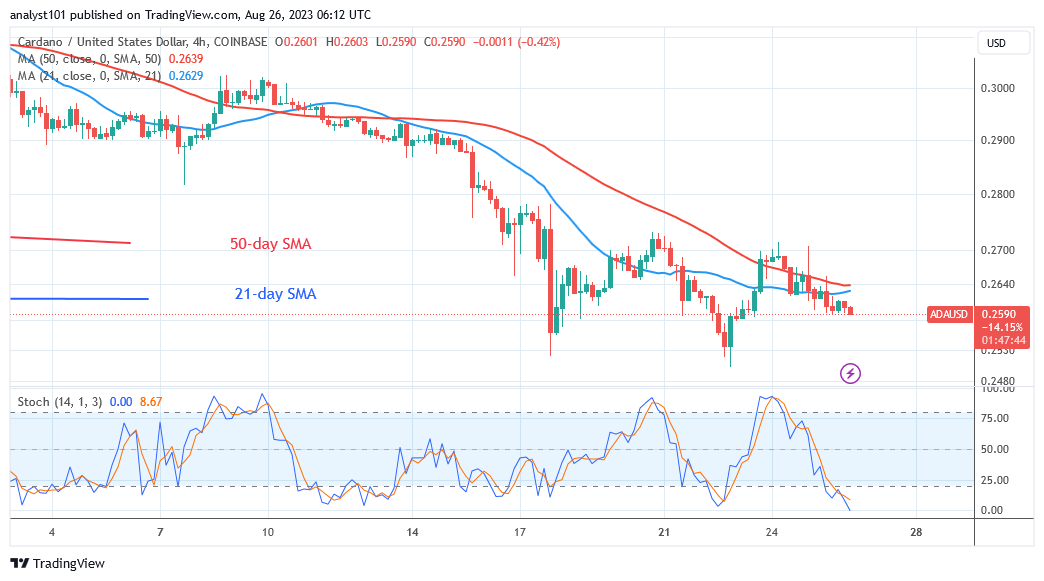
Cardano is currently in a sideways trend, with the altcoin remaining above the $0.25 support level. For the last week, neither buyers nor sellers had gained price control. The price of the altcoin has been oscillating between $0.25 and $0.27. The resistance at $0.27 has halted the upward movement.
A price rebound above the current support, on the other hand, will break through the resistance at $0.27. The upward trend will continue to the high of $0.32.
Technical Indicators:
Major supply zones: $1.0, $1.05, $1.10
Major demand zones: $0.45, $0.40, $0.35
Cardano (ADA) Indicator Analysis
Cardano is correcting upward at Relative Strength Index period 14 level 36. Following a modest price movement, the coin remains in the bearish trend zone. As the crypto asset approaches the market’s oversold region, it will rise once more. The altcoin is trading below the daily Stochastic level of 20.
When buyers emerge in the oversold region, the altcoin will increase.
What Is the Next Move for Cardano (ADA)?
The crypto asset may continue to fluctuate in a range if purchasers are unable to keep the price above the $0.27 barrier. If the altcoin breaks through the barrier, it will move above the moving average lines. Meanwhile, ADA/USD is declining as it reaches the lower price range of $0.25.
You can purchase crypto coins here. Buy LBLOCK
Note: Cryptosignals.org is not a financial advisor. Do your research before investing your funds in any financial asset or presented product or event. We are not responsible for your investing results