Ethereum (ETH/USDT) Seeks to Hold Above $1,850 Critical Level
Estimated Reading Time: 3 minutes
Don’t invest unless you’re prepared to lose all the money you invest. This is a high-risk investment and you are unlikely to be protected if something goes wrong. Take 2 minutes to learn more
Ethereum Long-term Analysis: Bearish
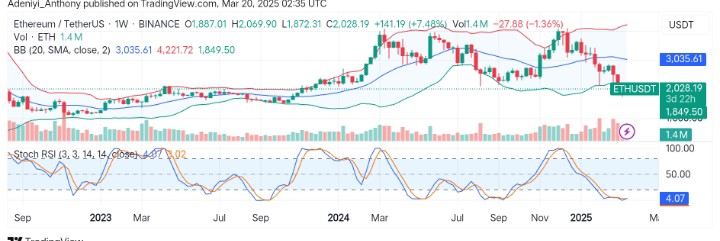
The market sentiment overall for Ethereum against Tether has been bearish for a prolonged number of weeks. However, the pair appears to be at a critical junction, recording a substantial gain of 7.48% after hitting the lower band at $1,849 in the previous session.
As it is, the Bollinger bands indicate increased volatility, while the Stochastic RSI signals an oversold condition. Could this be a sign of a possible northbound bounce? However, the volume is still low, suggesting the current move lacks strong conviction.
Currently, Ethereum trades at $2,028, moving 140 places to the north with 1.4 million traded volume for the week.
Technical Indicators
Major Resistance Levels: $2,250, $2,500, and $3,035
Major Support Levels: $1,850, $1,700, and $1,500
Ethereum Technical Analysis
The market analysis for Ethereum against the Tether on a weekly chart shows the pair is making a move for a short-term bounce with expanding Bollinger bands. This suggests a move towards $3,035.61 even with low market participants.
On the other hand, the Stochastic oscillator hints at a potential short-term movement as the indicator signals a move away from the oversold region, indicating an improvement towards the north.
As it is, the pair must break above $2,250 for a confirmed move towards $3,035; otherwise, a drop below the current level could lead to a further downtrend.
ETH/USDT Analysis: What to Expect
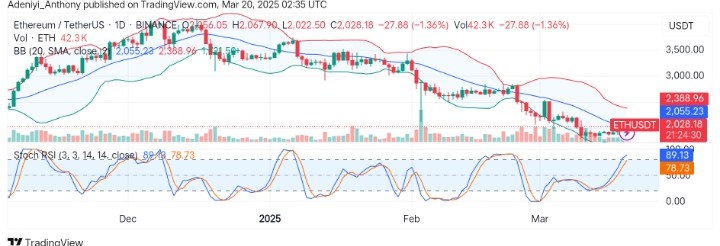
On the daily chart, the analysis of ETH/USDT shows the pair is recovering from a previous low. However, the chart shows ETH is in a downtrend, underneath the 20-period dynamic moving average of the downward-moving Bollinger bands.
The Stochastic oscillator, on the other hand, signals an overbought situation as lines Seek to extend their way above the 80-mark level, suggesting a possible short-term bounce. However, the 42.3 thousand volumes for the day show more volumes are needed for a significant move.
To this end, if the price can suspend and maintain current momentum above the $2,055, a move towards the $2,250 level could materialize; otherwise, a rejection at the dynamic band level would lead to a re-test of the $1,900 level.
You can purchase crypto coins here. Buy LBlock