Ethereum (ETH/USDT) Bearish Traders Extend Dominance
Estimated Reading Time: 3 minutes
Don’t invest unless you’re prepared to lose all the money you invest. This is a high-risk investment and you are unlikely to be protected if something goes wrong. Take 2 minutes to learn more
ETH Long-term Analysis: Bearish
For some time, the market for Ethereum against the Tether (USDT) has been consistently falling after hitting the above $3,000 level, with failed attempts to stabilize as the price chose the South pathway.
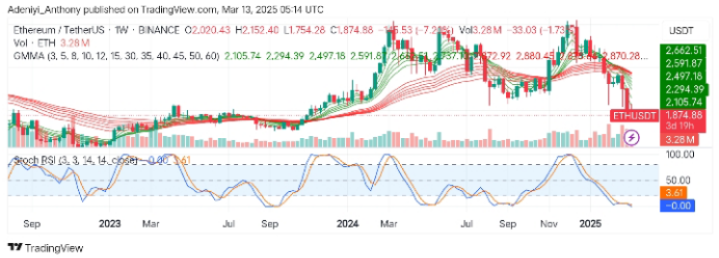
Recently, the pair has seen another dip as the Guppy Multiple Moving Averages (GMMAs) display a bearish crossover. However, the oscillator at the bottom of the chart suggests an oversold condition; could it be the right moment for an upside movement?
To the end, Ethereum trades at $1,874.88, with a moderate traded volume of 3.28 million, and records a decline of 7.13% for the week.
Technical Indicators
Major Resistance Levels: $2,105.74, $2,294.54, and $2,500.00
Major Support Levels: $1,754.25, $1,700.00, and $1,500.00
Ethereum Technical Analysis
The weekly analysis for Ethereum against the Tether shows that the pair acts under strong bearish pressure as the GMMAs display a crossover to the South. This suggests the bears are in control as the coin witnesses a huge sell-off.
On the other hand, the Stochastic RSI signals the pair is consolidating at a recent level as the lines extend to the front. However, the price has responded to the blue’s little tick to the south.
To this end, ETH may oscillate at the current level before recording any gain, as the oscillator also suggests a long-term potential reversal may be near.
ETH/USDT Analysis: What about Now?
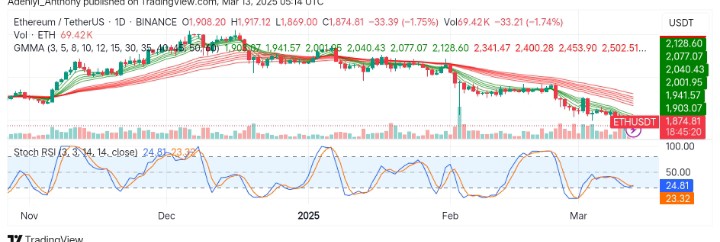
On the daily timeframe, ETH/USDT appears to be consolidating as its price ranges within a tight region. However, the overall market sentiment remains bearish as both EMAs of the GMMAs trend downward.
The Stochastic RSI on the other side indicates the price may be ready for a short-term reversal as the blue line improves to the North. However, more improvements are needed as ETH faces strong bearish pressure.
To this end, the pair needs to maintain the $1,850.00 level to move towards $2,000.00; otherwise, more bearish dominance would push the price below $1,754.28.
You can purchase crypto coins here. Buy LBlock