Ethereum (ETH/USDT) Faces Strong Bearish Pressure, Drops by 13%
Estimated Reading Time: 3 minutes
Don’t invest unless you’re prepared to lose all the money you invest. This is a high-risk investment and you are unlikely to be protected if something goes wrong. Take 2 minutes to learn more
Ethereum Long-term Analysis: Bearish
The market for Ethereum over some period has witnessed a significant decline, dropping further toward lower support levels against the Tether. This shows that the pair is experiencing a strong sell-off as the pair fails to hold above key levels. However, this decline is accompanied by moderate weekly activity, suggesting increasing bearish pressure.
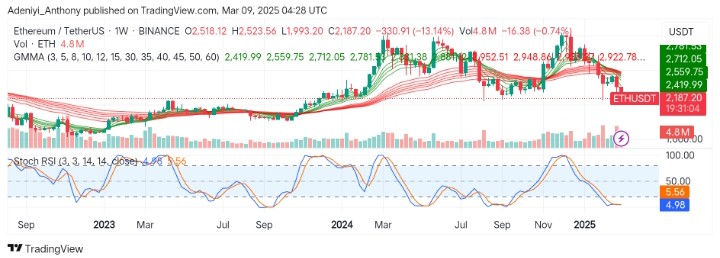
Recently, Ethereum has been dropping after attaining a local height of around $2,781, confirmed by the crossover of the Guppy Multiple Moving Averages (GMMAs). However, the positioning of the Stochastic RSI indicates a glimpse of hope on the horizon.
To this end, Ethereum trades at $2,187.20, with 4.8 million traded volumes for the week.
Technical Indicators
Major Resistance Levels: $2,419.99, $2,559.75, and $2,712.05
Major Support Levels: $2,000.00, $1,952.51, and $1,881.38
Ethereum Technical Analysis
On the weekly timeframe, the chart of Ethereum against the Tether shows a bearish crossover of the GMMAs, as the short-period EMAs converge below the long-period EMAs. This indicates an increasing bearish momentum, a sign of market dominance by the sellers.
On the other hand, the Stochastic RSI signals an extreme oversold condition as the lines operate below the 10-mark level, suggesting a potential short-term bounce could occur provided buyers step in. At this juncture, the pair’s movement remains uncertain.
However, a break below the psychological $2,000 level would drag the price further south; otherwise, a move toward $2,419 would indicate renewed hope.
ETH/USDT Analysis: What to Expect
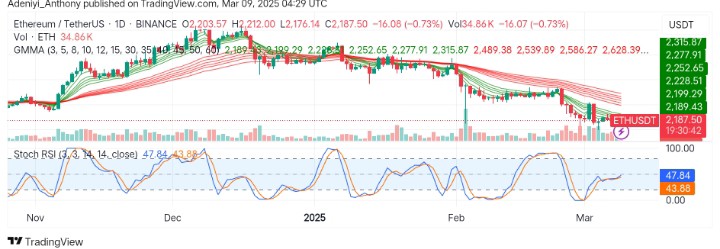
On the daily timeframe, ETH/USDT continues its downtrend, with a marginal loss of 0.73%. However, the pair seems to be struggling to break above key resistance levels, but bearish pressures, as clearly indicated by the GMMAs, persist.
Additionally, the Stochastic RSI below the chart suggests the market lacks participants as lines operate in the neutral zone, capturing the low number of market participants.
To this end, a move above $2,277 would signal the beginning of a recovery. From another angle, ETH/USDT remains under the control of the sellers, and the low trading volume suggests weak momentum, an indication that the pair may continue to decline or stabilize at this level.
You can purchase crypto coins here. Buy LBlock