Ethereum (ETH/USDT) Eyes Recovery Above $3,118.16 Critical Level
Estimated Reading Time: 3 minutes
Don’t invest unless you’re prepared to lose all the money you invest. This is a high-risk investment and you are unlikely to be protected if something goes wrong. Take 2 minutes to learn more
Ethereum Long-term Analysis: Bearish
The market for Ethereum against the Tether over the past few weeks has shown volatile price movement, with prices trending downward. This trend can be captured on the chart, which shows it moving from its previous high around the beginning of this year to its current level.
Recently, Ethereum has taken a U-turn, aiming at the mid-Bollinger band, while the Stochastic RSI signals the exhaustion of selling pressure. To this end, the market needs more bullish traders as it records an over 3% gain above the previous session.
Currently, Ethereum trades at $2,742.91, with just 1.7 million traded volumes for the week.
Technical Analysis
Major Resistance Levels: $3,118.16, $3,500, and $4,047.83
Major Support Levels: $2,500, $2,188.48, and $2,000
Ethereum Technical Analysis
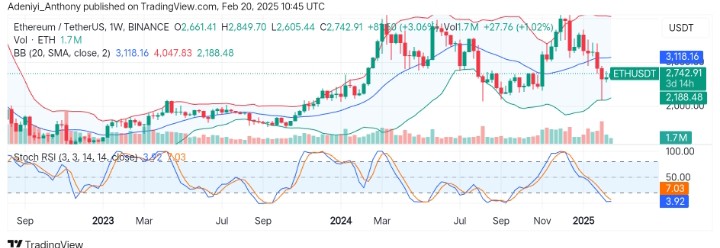
On the weekly timeframe, the analysis of Ethereum against the USDT suggests the pair is bound for a journey to the north, as the price shows signs of improvement towards the mid-band, which serves as the current dynamic resistance.
From another angle, the stochastic oscillator at the bottom of the chart shows the extent of bearish activities in the market. However, the market is oversold, but the curvature of the blue line indicates that bullish momentum is building. Therefore, the lines must form a bullish crossover to confirm this move.
To this end, if ETH holds above the current price, a move toward $3,118 could materialize; otherwise, a retracement below the immediate support level would signal a continuation of the downtrend.
ETH/USDT Analysis: What’s Next?
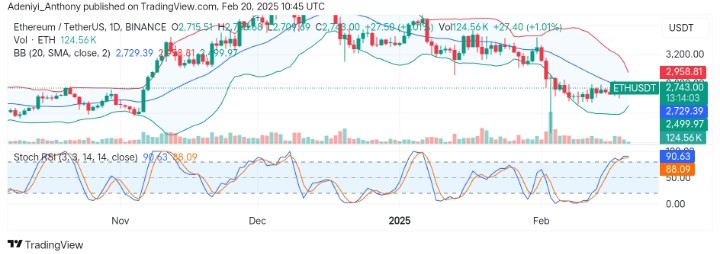
On the daily timeframe, ETH/USDT has gained over 1% in price. However, recent price action indicates a potential consolidation phase, as the candlestick assembles on a straight line. This suggests the market lacks enough participants.
On the other end, the stochastic RSI signals that the pair is overbought, and a potential retracement or extended consolidation phase is looming. However, the current condition provides further avenues for bullish traders to push the price higher.
To this end, the pair is in a recovery phase, but the overbought situation of the oscillator suggests caution. However, in the near term, if ETH/USDT does not break above $2,800, traders may abandon a move toward $3,118.
You can purchase crypto coins here. Buy LBlock