Chainlink (LINK/USDT) Consolidates Within Compressed Bands, Awaits Volatility Break
Estimated Reading Time: 3 minutes
Don’t invest unless you’re prepared to lose all the money you invest. This is a high-risk investment and you are unlikely to be protected if something goes wrong. Take 2 minutes to learn more

ChainLink Long-term Analysis: Bullish
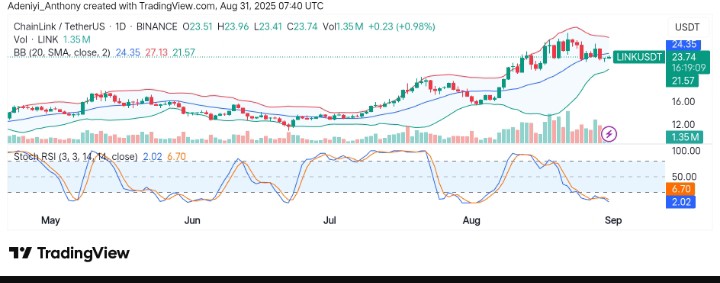
ChainLink against Tether has seen much upside movement in recent weeks, breaking resistance despite occasional sideways movements. At the moment, LINK is currently trading around $23.00, sitting just above the lower line of the Bollinger Bands ($21.57).
As it stands, the candles show no directional movement after the strong bullish run in August. This suggests the market is indecisive, and a surge in price action might trigger a breakout above $24.35 or a breakdown. The recent wicks on both sides indicate buyers are defending the $23 region, while sellers are capping upside momentum near $25.
Currently, ChainLink trades at $23.74 with a moderate trading volume of 1.35 million.
Technical Indicators
Major Resistance Levels: $24.35, $27.13, and $30.00
Major Support Levels: $23.00, $21.57, and $20.00
ChainLink Technical Analysis
ChainLink against Tether on a daily timeframe appears to be cooling off; its movement within the Bollinger Bands shows conflicting interest. The bulls want more gains, and as the price tends to the north, the bears appear to be stronger at the $24.35 level.
The Stochastic RSI, on the other hand, suggests reduced momentum, and from the look of things, the price appears to be building a base at the current level. To this end, expect a slight pullback towards the $23.00 level due to the oversold condition of the RSI before an extended move to the north.
ChainLink Ready for an Upside Move?
ChainLink has been showing signs of a continuous uptrend and higher path in recent times. However, with the possibility of a pullback, the coin appears to be holding above a strong $13 support on the larger timeframe. At the moment, the market appears to be testing the last month’s swing high, seeking to hold above it for a continued upside move. To this end, a move below it may not translate to deeper correction but an avenue for the bull to make greater gains.
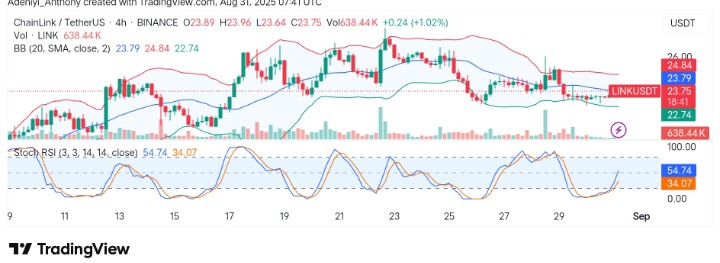
LINK/USDT Short-term Analysis: Consolidating for More Gains
On the shorter timeframe, LINK/USDT appears to be moving between the tight space provided by the Bollinger Bands, signaling reduced momentum. The price seems to be moving on a straight line after $24.80 remains unaffected, with the $22.00 providing necessary support.
On the other hand, the Stoch RSI is recovering from lower levels, with the blue line crossing above orange, hinting at short-term bullish momentum. However, traders await a breakout trigger, as the volume appears thin, reflecting a pause in the price movement.
To this end, if the momentum is sustained above the current level, the immediate target becomes the $24.80 resistance zone. Conversely, failure to hold the $22.70 support range, the price risks further downside pressure.
You can purchase crypto coins here. Buy Crypto