ChainLink (LINK/USDT) Navigates Resistances and Supports for a Potential Breakout
Estimated Reading Time: 3 minutes
Don’t invest unless you’re prepared to lose all the money you invest. This is a high-risk investment and you are unlikely to be protected if something goes wrong. Take 2 minutes to learn more

ChainLink Weekly Analysis: Bullish
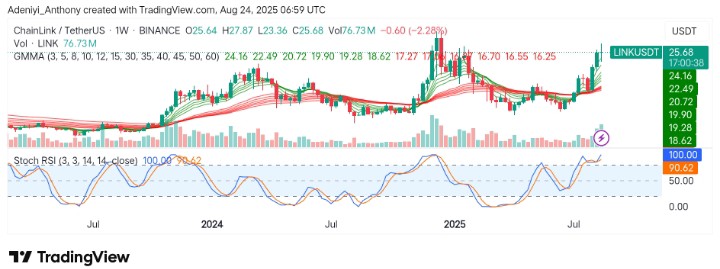
ChainLink against Tether on the weekly chart shows a strong bullish trend with the price moving towards key resistance levels. The Guppy Multiple Moving Averages (GMMA) indicate strong buying pressure, with the short-term moving averages (red) above the long-term averages (green). This signals continued upward momentum.
However, the Stochastic RSI suggests that ChainLink is in an overbought condition, potentially signaling a short-term pullback or range-bound movement at the current level.
At the moment, ChainLink has recorded a traded volume of over 76.7 million while positioning at $25.68.
Technical Indicators
Key Resistance Levels: $26.00, $27.80, and $31.00
Key Support Levels: $24.16, $22.49, and $20.72
ChainLink Technical Analysis
Technically, ChainLink against Tether on the weekly timeframe appears to be prepared for an uptrend as signaled by indicators like the GMMA and volume. Both indicators have displayed that the bullish trend is still intact.
However, the overbought conditions indicated by the Stochastic RSI suggest a pullback could occur before further price advancements to the north. To this end, a break above the next threshold, which is $26.00, would signal a move above $31.00. However, this does not rule out the possibility of a minor pullback before the next leg up.
ChainLink Ready for a Skyrocketing Move
Link against Tether appears to be holding above $24.90 very well for a move above the $26.42 level on a smaller timeframe. Considering the wave movement breakout from the current level to the upside may not be direct, a move towards $23.00 may play out before a bullish rally.
At the moment, the pair appears to have built strong support, as indicated by the Elliot wave, and what is next is an upside movement similar in the smaller and larger timeframes.
LINK/USDT Analysis: Monitoring Short-term Correction
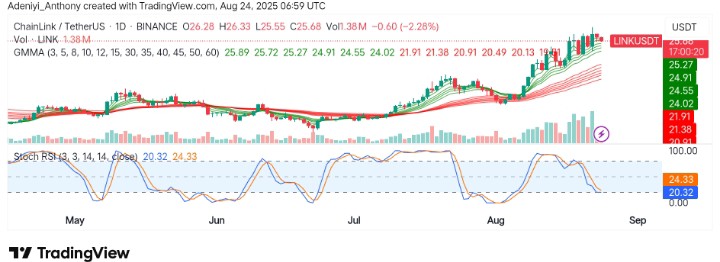
On the daily timeframe, LINK/USDT is still maintaining a bullish structure. However, the price appears to have a fixed gaze on the immediate support at $24.02, though the GMMA suggests the upside trend remains strong.
The Stochastic RSI, on the other hand, reads 20.32, suggesting that the price may be nearing oversold conditions, which could bring about a short-term pullback. However, the volume in this timeframe confirms the strength of the uptrend, with key resistance seen at $26.28 and $27.87. To this end, a move past these levels would spark more upside trajectory towards $31.00; otherwise, a break below $24.02 might suggest a short-term pullback.
You can purchase crypto coins here. Buy Crypto
