Solana (SOL/USD) Bull Market Continues Following Temporary Halt Above $40 Price Threshold
Estimated Reading Time: 3 minutes
Don’t invest unless you’re prepared to lose all the money you invest. This is a high-risk investment and you are unlikely to be protected if something goes wrong. Take 2 minutes to learn more
When the Solana market breached both the $30 and $32 price thresholds, it encountered a significant pause at the latter, which holds historical significance as the market initially tested this level in mid-July. Between late October and the first day of November, the price surpassed the $40 price zone. Subsequently, the Solana market initially tested the $47 level but retraced to find support around $40. Following a brief consolidation around the $40 price point, the market resumed its ascent towards the $50 level.
Solana Market Data
- SOL/USD Price Now: $47.8
- SOL/USD Market Cap: $20,978,891,982
- SOL/USD Circulating Supply: 421,018,109 SOL
- SOL/USD Total Supply: 562,119,848 SOL
- SOL/USD CoinMarketCap Ranking: #7
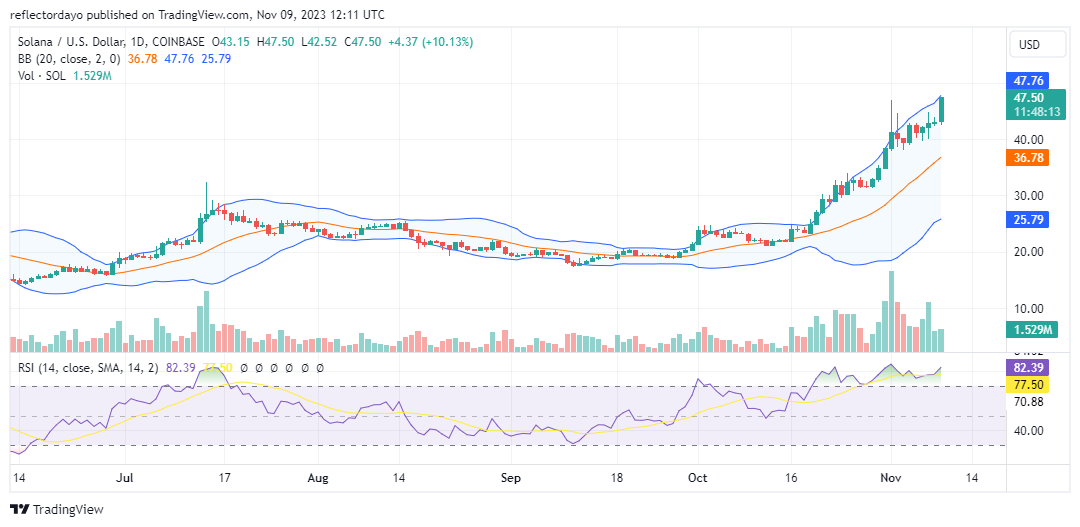
Key Levels
- Resistance: $50, $55, and $60.
- Support: $40, $35, and $30.
The Solana Price Forecast: Analyzing the Indicators
The Solana market has exhibited a bullish trend since mid-October, and it is currently approaching the $50 price level. However, the rapid ascent driven by the bulls has intensified market volatility. The Bollinger Bands illustrate an upward-moving market with a significant bandwidth.
Despite the elevated liquidity in the bullish market, there is a potential for a bearish reversal at the $50 price level. This is attributable to traders positioning selling orders at this level, coupled with the Relative Strength Index indicating an extended period of overbought conditions. Consequently, the market may succumb to a bearish phase.
On the other hand, the robust trade volume suggests strong market sentiment, which could sustain the ongoing bullish trend. Therefore, while a bear market is a possibility, the prevailing strong trading activity may support the continuation of the current market trend or a very strong price reversal.
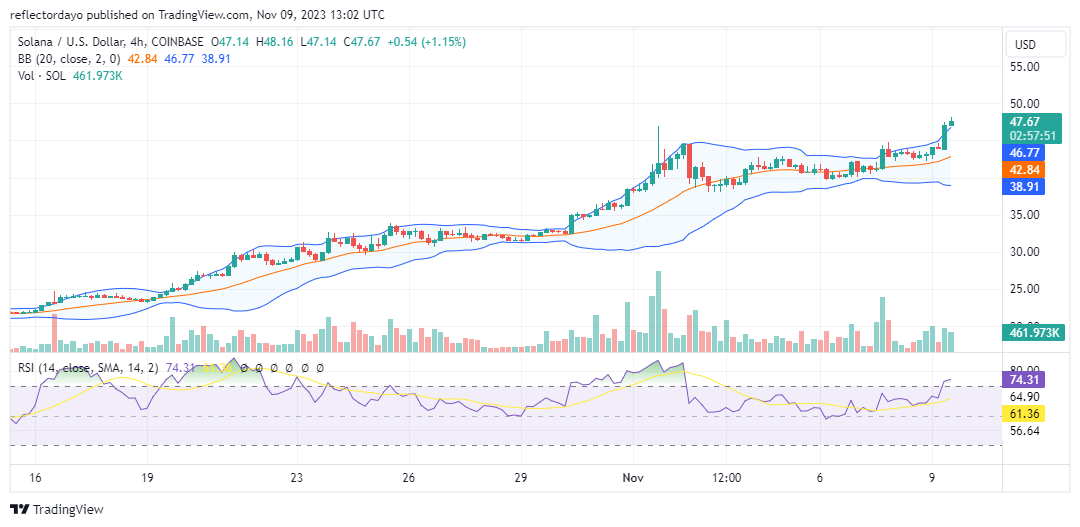
SOL/USD 4-Hour Chart Outlook
As the market approaches the $50 price level, it is notable that the recent candlestick exhibits a diminished height, even though it is accompanied by a substantial histogram. These market dynamics can be attributed to a state of indecision among market participants. As the price nears the $50 threshold, we anticipate a period of consolidation before a definitive market direction emerges.