Origin Protocol (OGN/USD) Registers a Modest 3.6% Gain as it Progresses Steadily Towards its Target
Estimated Reading Time: 3 minutes
Don’t invest unless you’re prepared to lose all the money you invest. This is a high-risk investment and you are unlikely to be protected if something goes wrong. Take 2 minutes to learn more
After testing the $0.200 price level on the final day of September, the Origin Protocol market established a range below the $0.150 price point, ultimately finding stability around the $0.107 level. Subsequently, the market embarked on a gradual and consistent ascent towards the $0.150 price threshold, driven by mounting buying pressure that has been steadily overcoming bearish resistance. The market has now reached the $0.130 resistance level.
Origin Protocol Market Data
- OGN/USD Price Now: $0.129
- OGN/USD Market Cap: $97,554,799
- OGN/USD Circulating Supply: 749,902,821 OGN
- OGN/USD Total Supply: 1,000,000,000 OGN
- OGN/USD CoinMarketCap Ranking: #287
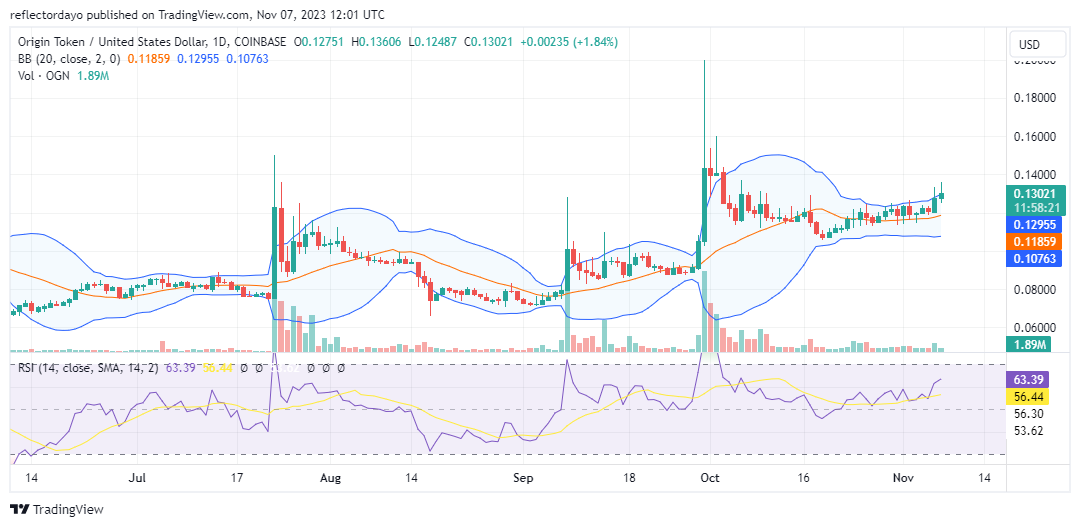
Key Levels
- Resistance: $0.130, $0.150, and $0.200.
- Support: $0.100, $0.0900, and $0.800.
The Origin Protocol Price Forecast: Analyzing the Indicators
The $0.130 resistance level was established in early October, and currently, Origin Protocol is encountering bullish pressure at this level. An observation of yesterday’s and today’s bullish candlesticks reveals an upper shadow, indicating heightened selling activity around the $0.130 price point. As the bull market continues its push toward the $0.200 price target, it must address this cluster of selling activities.
While the market appears poised for a bullish price movement, as evident from signals provided by the Bollinger Bands indicator and the Relative Strength Index (RSI), concerns about low trading volume may pose challenges in breaching major resistances, such as the $0.150 price level. Nevertheless, both the Bollinger Bands indicator and the RSI indicate a bullish trend in the market.
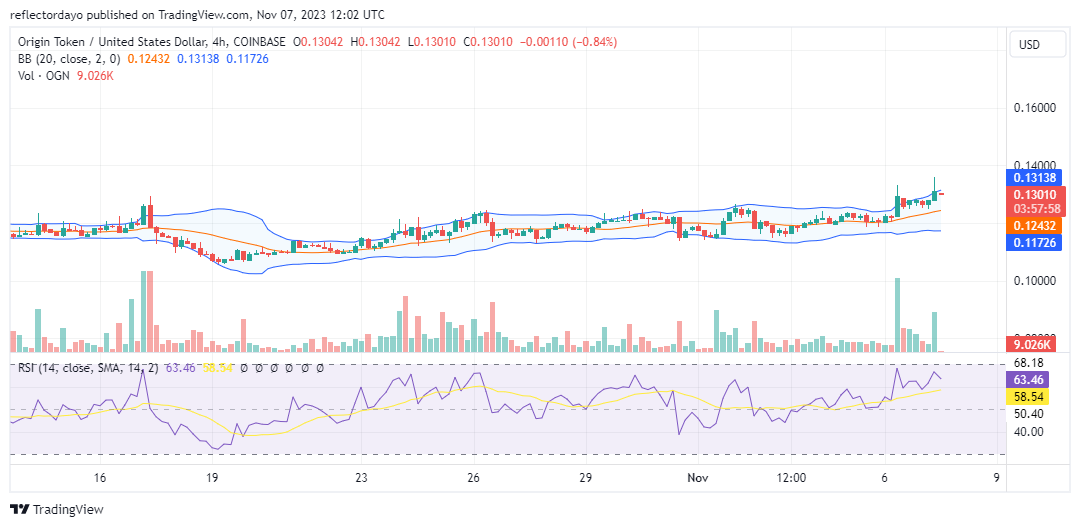
OGN/USD 4-Hour Chart Outlook
In the shorter timeframe, the market exhibits a subtle upward-trending price channel, characterized by a series of ascending lows. This pattern indicates the bulls’ persistent effort to breach the resistance. Nevertheless, it is worth noting that buying momentum has been waning, even as the market maintains its higher low pattern and remains positioned above the 20-day moving average.
Traders are advised to remain vigilant, as a potential breakthrough of the $0.130 resistance level could pave the way for a move to the $0.140 price threshold.