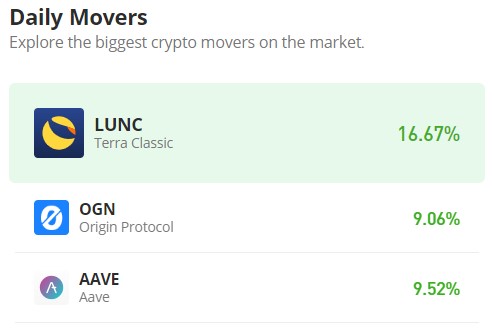
Origin Protocol (OGN/USD) Bulls Shift Their Attention to the $0.2000 Price Threshold
Estimated Reading Time: 3 minutes
Don’t invest unless you’re prepared to lose all the money you invest. This is a high-risk investment and you are unlikely to be protected if something goes wrong. Take 2 minutes to learn more
On the final day of September, the Origin Protocol bull market exhibited remarkable aggressiveness, with prices surging vigorously, even testing the $0.200 threshold. However, as is often the case with such robust price movements, the bulls could not maintain the significant price swing, which fluctuated between the $0.100 and $0.200 levels. The $0.150 price level abruptly curtailed the bull market’s momentum. Since the onset of October, price fluctuations have consistently remained below the $0.150 mark, establishing it as a prominent resistance level.
Origin Protocol Market Data
- OGN/USD Price Now: $0.129
- OGN/USD Market Cap: $97,58,453
- OGN/USD Circulating Supply: 749,902,821 OGN
- OGN/USD Total Supply: 1,000,000,000 OGN
- OGN/USD CoinMarketCap Ranking: #282
Key Levels
- Resistance: $0.130, $0.150, and $0.200.
- Support: $0.100, $0.0900, and $0.800.
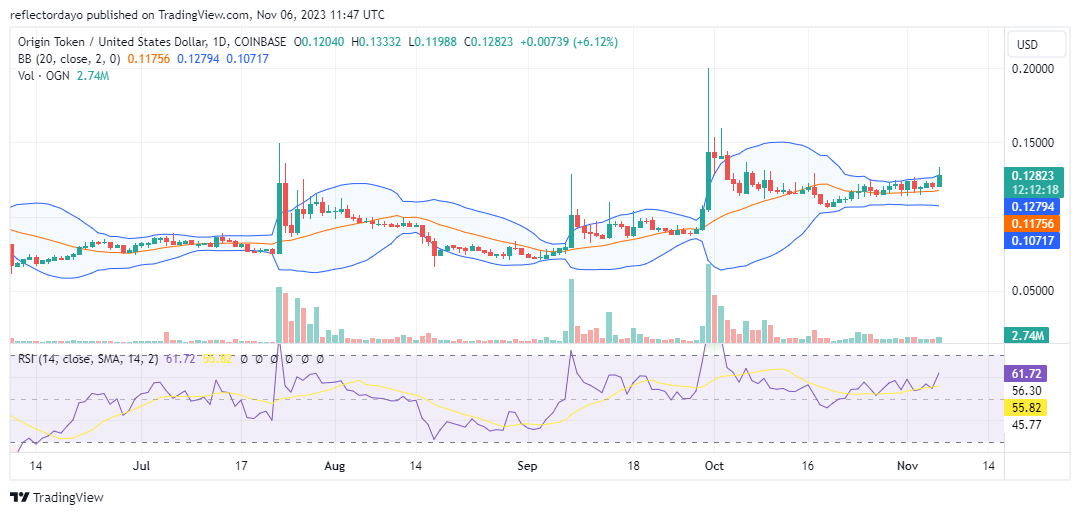
The Origin Protocol Price Forecast: Analyzing the Indicators
As September drew to a close, the previously volatile Origin Protocol market transitioned into a more stable phase, centering around the $0.1200 price level. This consolidation was visually represented by the Bollinger Bands indicator, which formed narrower bands around the price action. Toward the end of October, the price managed to surpass the 20-day moving average, marking the initial step taken by the bulls to retrace back to the September 30th high of $0.200. In today’s market, bullish forces seem to be exerting considerable strength in overcoming bearish resistance, potentially aiming for the key resistance level of $0.200. This evident bullish surge is causing the upper band to diverge, signifying the increasing influence of bullish traders in the market.
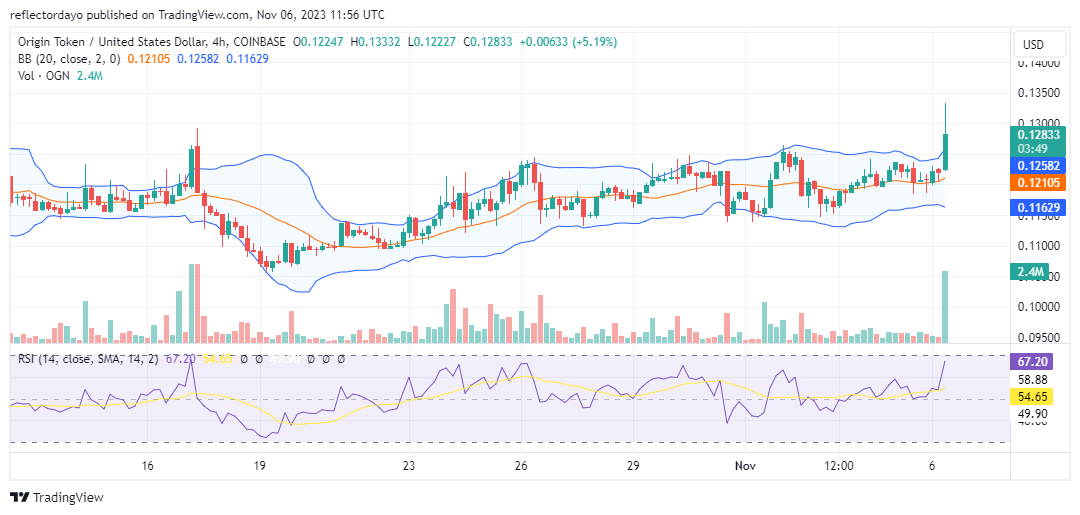
OGN/USD 4-Hour Chart Outlook
On the 4-hour timeframe, a discernible mild upward trend is observable. Conversely, the daily chart reveals a horizontal movement, as indicated by the Bollinger Bands; however, on this timeframe, the Bollinger Bands depict a modestly upward trending price channel.
Notably, the market is currently showing a series of slightly higher lows, suggesting that the bull market maintains a slight upper hand. In today’s market, especially within the third 4-hour session, the trade volume indicator indicates a substantial influx of traders, resulting in heightened liquidity levels. This increased liquidity is contributing to an elevated level of volatility. Nevertheless, the bull market’s strength appears to be relatively modest, considering the gradual upward trajectory of the market; it’s possible that the bulls may encounter substantial resistance at the $0.150 price level.