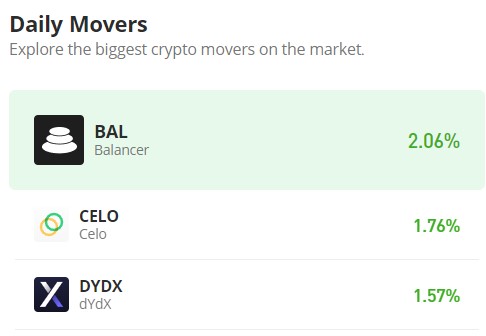
The Celo Market (CELO/USD) Faces Critical Juncture as Bulls Encounter Key $0.600 Price Threshold
Estimated Reading Time: 3 minutes
Don’t invest unless you’re prepared to lose all the money you invest. This is a high-risk investment and you are unlikely to be protected if something goes wrong. Take 2 minutes to learn more
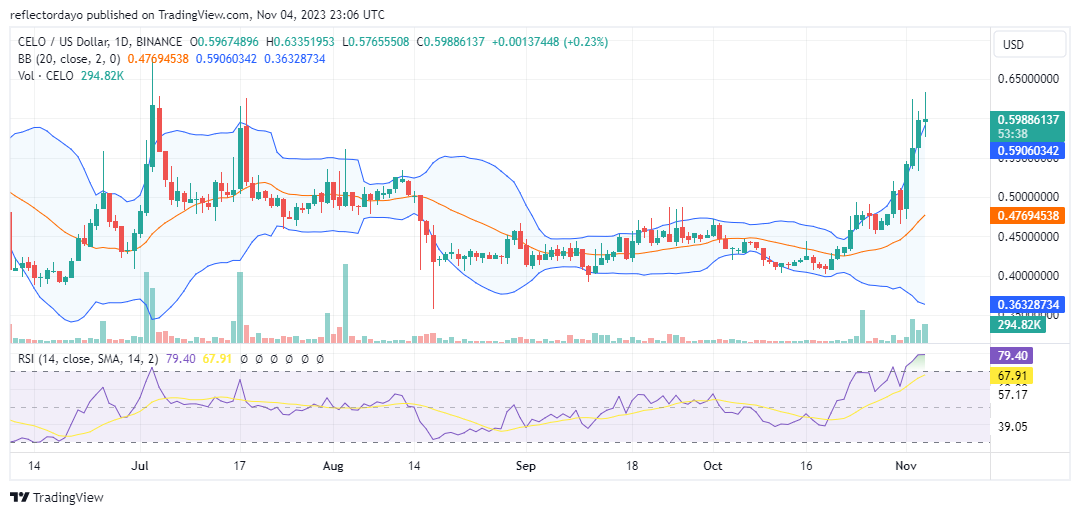
After the initiation of the bull market on October 20, it swiftly gained momentum, marking a substantial upward trend. Initially, this upward trajectory lacked strong trader conviction, as trading volume did not align with the significant price gains. However, with the transition into November, the market experienced another noteworthy shift in a bullish direction, driven by renewed interest among traders.
The Celo Market Data
- CELO/USD Price Now: $0.591
- CELO/USD Market Cap: $296.78 Million
- CELO/USD Circulating Supply: 518.36 Million
- CELO/USD Total Supply: 42.09 Million
- CELO/USD CoinMarketCap Ranking: #108
Key Levels
- Resistance: $0.600, $0.650, and $0.700.
- Support: $0.450, $0.400, and $0.350.
The Celo Market Price Forecast: Analyzing the Indicators
The Relative Strength Index (RSI) indicates an increase in market volatility, despite a limited expansion in trading volume. The bull market’s liquidity has propelled prices to the $0.6000 level, resulting in a noticeable divergence of the Bollinger Bands. Furthermore, over the weekend, the Celo market‘s movement toward the critical $0.600 price point has seemingly prompted significant activity in the bear market. This is evident in the emergence of spinning top candlesticks, suggesting a possible convergence around the $0.6000 price level.
Nevertheless, the bulls maintain a dominant position in the market. Based on the current market trajectory, it is plausible that the bulls may eventually breach the key resistance level at $0.600.
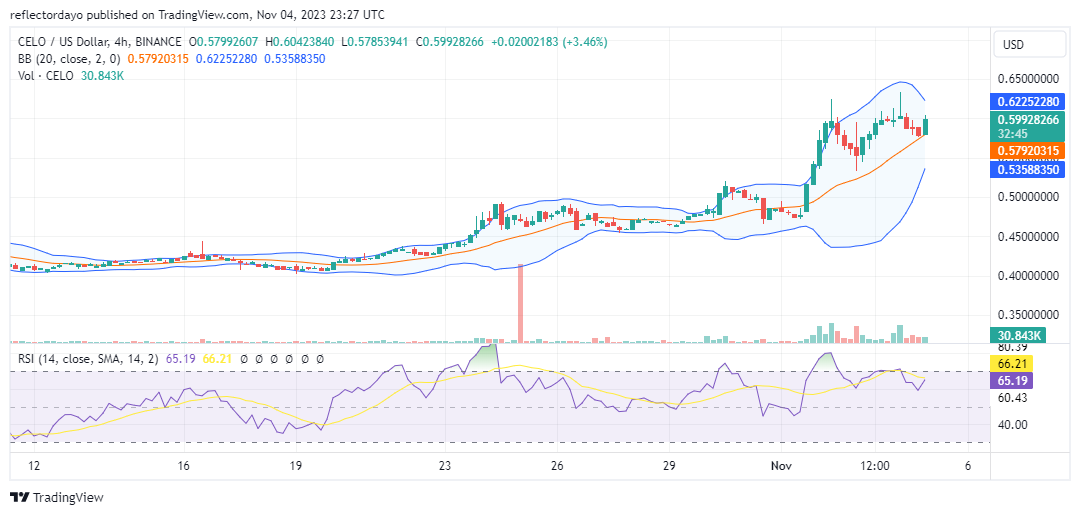
CELO/USD 4-Hour Chart Outlook
In the 4-hour timeframe for CELO/USD, a temporary consolidation is observed in the vicinity of the pivotal $0.6000 price level, accompanied by the Bollinger Bands rapidly converging near the resistance. This tightening of volatility around the price point suggests the potential for an impending price breakout. The emergence of a new higher support level at $0.5794 adds bullish momentum, exerting pressure on the bearish resistance. Given the current dynamics, there is a possibility of the bull market sustaining its trend, as indicated by the upward trajectory within the Bollinger Bands, reflecting an ascending price channel.