Ethereum (ETH/USDT) Bullish Traders Show Renewed Interest Amidst Market Conditions
Estimated Reading Time: 3 minutes
Don’t invest unless you’re prepared to lose all the money you invest. This is a high-risk investment and you are unlikely to be protected if something goes wrong. Take 2 minutes to learn more
Ethereum Long-term Analysis: Bearish
The market for Ethereum and Tether has experienced a strong correction after a bullish rally towards the end of last year. The pair has entered a strong correction phase, breaking a series of support levels. This shows that the bears have been dominating the market since the beginning of the year, as seen in the pair’s deviation from the previous high, which is around the $4,000 level.
Recently, the price seems to be attempting a recovery with the formation of a bullish candlestick despite the current trend. To this end, the bulls may push the price significantly to the north if bullish participation increases.
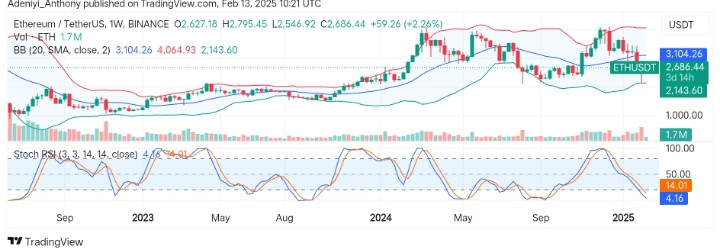
Currently, Ethereum trades at $2,686.44, recording a gain of 2.26% with 1.7 million traded volumes for the week.
Technical Indicators
Major Resistance Levels: $2,800, $3,100, and $3,500
Major Support Levels: $2,520, $2,350, and $2,100
Ethereum Technical Analysis
The analysis of Ethereum against the USDT on the weekly timeframe shows that the pair is attempting a rebound despite the overall market trend, as seen in the formation of the candlestick beneath the 20-period moving average of the Bollinger band.
However, recent price actions below the dynamic moving average suggest the price is heading south, but a close above $2,800 in the near term would confirm further moving; otherwise, a close below $2,500 might indicate the continuation of the current trend.
On the other hand, the Stochastic RSI signals an oversold condition for the pair as lines read a value lower than the 20-mark level. However, for a potential reversal to manifest, the lines must cross to further strengthen this signal. Contrarily, the market may see a continuation of the downtrend if lines extend.
ETH/USDT Analysis: Expectations
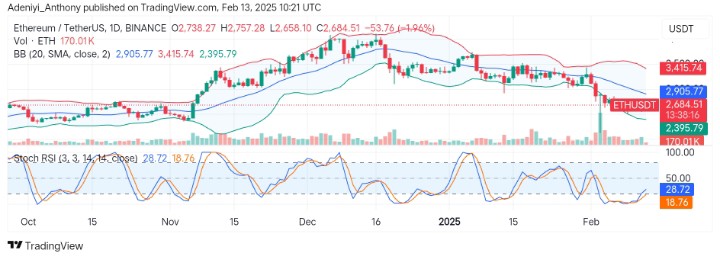
On the daily timeframe, ETH/USDT seems to be correcting after a failed attempt to hold above $2,900. Currently, the price appears to stabilize near the lower Bollinger band at $2,395, which serves as a dynamic support.
On the other hand, the Stochastic oscillator shows that bullish traders are beginning to flood the market as the lines change direction to the north.
To this end, if the price maintains its current position at $2,650, with an improved signal of the Stochastic RSI, a break close to $3,100 could be expected; otherwise, the price may continue to oscillate between the lower segment of the Bollinger bands.
You can purchase crypto coins here. Buy LBlock