Binance Coin Revisits the $280 Resistance as Buyers Recover To Resume Uptrend
Estimated Reading Time: 2 minutes
Don’t invest unless you’re prepared to lose all the money you invest. This is a high-risk investment and you are unlikely to be protected if something goes wrong. Take 2 minutes to learn more

Free Crypto Signals Channel
Binance Coin (BNB) Long-Term Analysis: Bullish
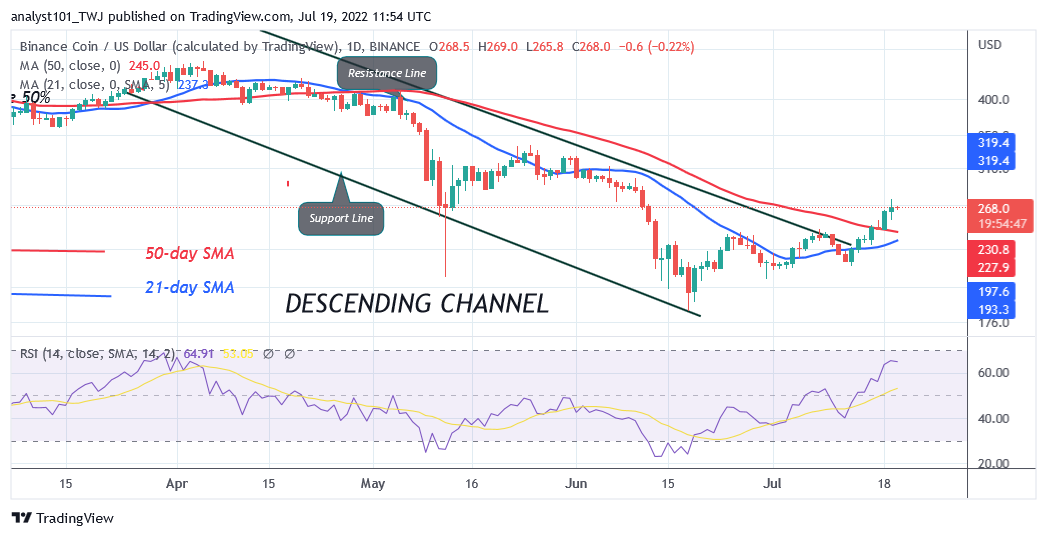
Binance Coin (BNB) has regained bullish momentum as buyers recover to resume uptrend. The cryptocurrency has risen to the high of $276 but faced rejection at the $280 resistance zone. The current resistance level is the previous support level of May 12. On the upside, if the bulls break the current resistance level, the market will rise to the previous highs of $330 and $403 price levels. Binance Coin will decline below the moving average lines if it faces rejection at the $280 resistance zone.
Binance Coin (BNB) Indicator Analysis
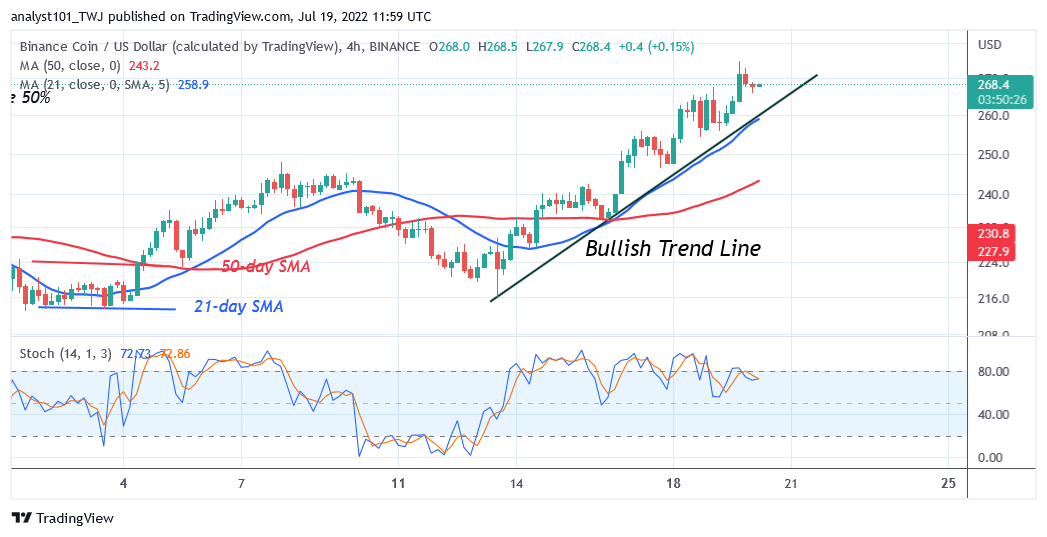
BNB is at level 65 of the Relative Strength Index for period 14. It indicates that BNB is in the bullish trend zone and may further rise to the previous highs. The crypto’s price bars are above the 21-day line SMA and 50-day line SMA, signaling the resumption upward move BNB is above the 70% range of the daily stochastic. The market is in a bullish momentum. The 21-day line SMA and the 50-day line SMA are sloping upward indicating the uptrend.
Technical indicators:
Major Resistance Levels – $640, $660, $680
Major Support Levels – $540, $520, $500
What` Is the Next Direction for Binance Coin (BNB)?
Binance Coin is making an upward correction as buyers recover to resume uptrend. The current uptrend has reached the overbought region. BNB price is now fluctuating in the overbought region. The altcoin will decline if it faces rejection at the recent high.
You can purchase crypto coins here. Buy LBLOCK
Note: Cryptosignals.org is not a financial advisor. Do your research before investing your funds in any financial asset or presented product or event. We are not responsible for your investing results