Estimated Reading Time: 3 minutes
Don’t invest unless you’re prepared to lose all the money you invest. This is a high-risk investment and you are unlikely to be protected if something goes wrong. Take 2 minutes to learn more
BNB Long-term Analysis: Bullish
After weeks of consolidation, the BNB market against the Tether shows signs of a strong trend reversal. However, the pair’s momentum appears to be above $670, reflecting a significant bullish sentiment as the price moves to the north.
Recently, BNB has been building bullish pressure since bouncing off the cluster moving averages, going as far as $677 this week while opening at $669. However, current price actions suggest a bullish breakout is underway, while the volume is increasing, confirming renewed market interest.
Currently, BNB trades at $674.68, printing over 50 thousand traded volumes for the week.
Technical Indicators
Major Resistance Levels: $690, $720, and $750
Major Support Levels: $624, $607, and $500
BNB Technical Analysis
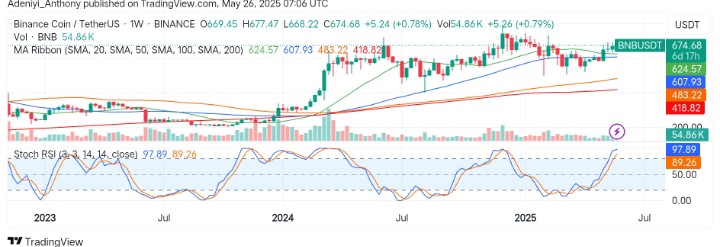
The analysis of BNB against the Tether on the weekly timeframe shows the pair is forming a new higher level while repeatedly testing the dynamic line around $670 while the price hit above the moving averages. This tightening setup combined with rising volume hints at a strong continuation pattern.
On the other hand, the Stochastic RSI displays an extreme overbought condition, which typically suggests caution as the blue line operates above the 97-mark level.
To this end, if the pair can close above $670 with increasing volumes, a move towards $750 could materialize.
BNB/USDT Analysis: Expectations
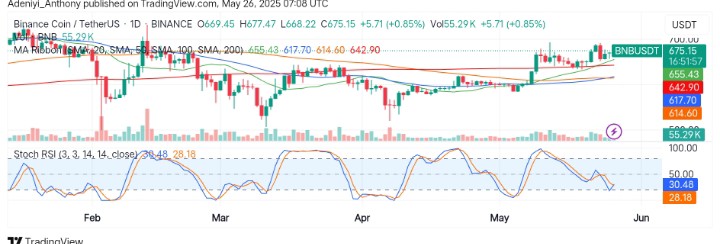
On the daily chart, BNB/USDT appears to be recording a 0.85% gain after a breakout above key resistance. As it stands, the price now trades well above the 200-day SMA at $642.90, signaling a shift toward long-term bullish momentum.
From another angle, the Stochastic RSI shows a bullish crossover near oversold territory as volume keeps rising, hinting at potential upward momentum.
To this end, a successful hold above $670 could pave the way for a retest of the $680–$700 zone. However, failure to sustain volume may trigger a pullback toward $642.90 or the 100-day SMA at $617.70.
You can purchase crypto coins here. Buy LBlock