BNB (BNB/USDT) Gears Up for a Make Move Amid Tightening Price Action
Estimated Reading Time: 3 minutes
Don’t invest unless you’re prepared to lose all the money you invest. This is a high-risk investment and you are unlikely to be protected if something goes wrong. Take 2 minutes to learn more
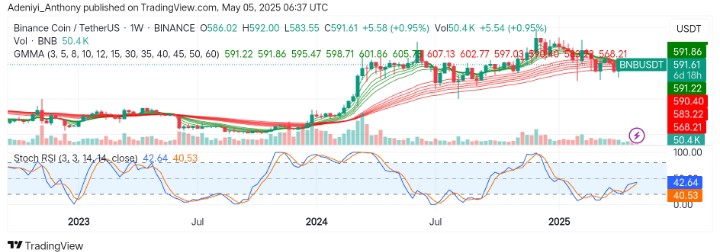
BNB Long-term Analysis: Ranging
The market for BNB against the Tether reveals a consolidation play within a high-volatility range after a long bullish run. However, with the price sandwiched between compressed Guppy Multiple Moving Averages (GMMAs), the pair prepares for either an upside movement or further correction.
Recently, BNB has pulled back from its height near $635, hovering around the $590 level. However, bullish momentum appears to be waning, but the pair sees no signs of breakdown yet. To this end, the volume and the Stochastic RSI signals improvement, suggesting a potential short-term bullish move. However, the price needs to break above the cluster of moving averages to confirm this move.
Currently, BNB trades at $591.61 with a rising trading volume and a positive marginal gain of 0.95% for the week.
Technical Indicators
Major Resistance Levels: $607, $635, and $700
Major Support Levels: $583, $568, and $500
BNB Technical Analysis
The analysis of BNB against the Tether on the weekly timeframe shows that the pair ranges within a tight space, woven with the compressed GMMAs. This suggests a slowing bullish strength. However, the trade is just starting, indicating a lack of strong conviction from the bulls and bears.
On the other hand, the Stochastic RSI appears to be facing north after leaving the oversold zone, indicating a possibility of a short-term run. A clear move above the 50-mark level would confirm this move, but the flattening blue line may hinder it.
To this end, a break above $607 with increasing volumes in the near term would suggest an expansion to the north. Conversely, a break below $583 could indicate a move to the south.
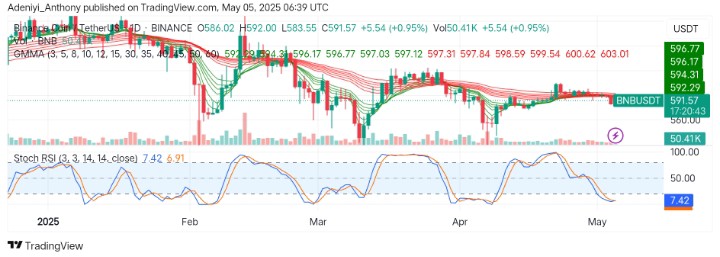
BNB/USDT Analysis: What’s Next?
On the daily chart, overall the outlook structure indicates a downward play as the price faces repeated rejection at the $596 while currently acting below the consolidated GMMAs.
From another angle, the Stochastic oscillator is deeply oversold. However, as the lines prepare for a bullish crossover, a short-term relief bounce might play out.
To this end, the traded volume appears too small, but the bearish crossover will reinforce continued distribution unless the bulls reclaim the $597 and $600 levels.
You can purchase crypto coins here. Buy LBlock