BNB (BNB/USDT) Approaches a Pivotal Crossroad as Bulls Seek Control
Estimated Reading Time: 3 minutes
Don’t invest unless you’re prepared to lose all the money you invest. This is a high-risk investment and you are unlikely to be protected if something goes wrong. Take 2 minutes to learn more

BNB Long-term Analysis: Bullish
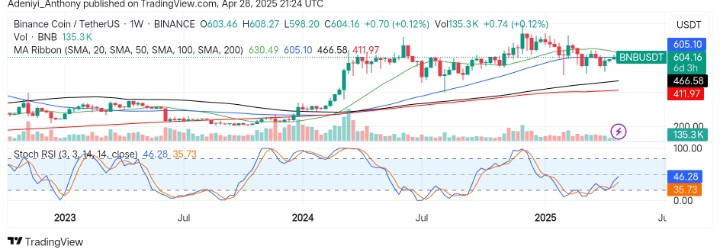
The market for BNB against the Tether has demonstrated relative strength in previous sessions, maintaining above key moving averages despite challenges posed by the sellers. However, the pair has given signs of more gains ahead as the price holds above the $600 psychological level.
Recently, weekly candles suggest ongoing battles between the bulls and bears as the momentum is tending toward the bullish traders. To this end, the Stochastic RSI hints at potential upside gains.
Currently, BNB trades at $604.16, recording a moderate 135.3 thousand at the beginning of the week.
Technical Indicators
Major Resistance Levels: $630, $670, and $720
Major Support Levels: $600, $598, and $466
BNB Technical Analysis
The price of BNB against the Tether on a weekly timeframe appears to be hovering around the 50-mark level at $605.10, as it trades above the 100 and 200 SMA. However, the flattening of the 20-SMA suggests momentum has slowed down.
On the other hand, the Stochastic oscillator signals the lines are just leaving the oversold region. This signals momentum is building up. However, if this continues upward, a stronger rally may be recorded
To this end, if BNB can push above $630 with a good volume, it would validate a breakout attempt toward $670 in the near term.
BNB/USDT Analysis: Will the Resistance Hold?
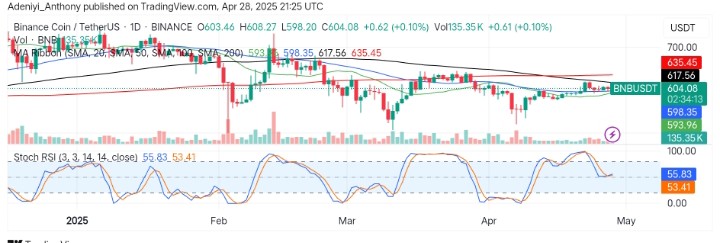
On the daily chart, BNB/USDT is consolidating just above $593 and $598, where the 20- and 50-day SMAs are, suggesting short-period upside movement. However, the behavior of the price underneath the longer-period SMAs indicates a tight resistance cluster ahead.
From another angle, the Stochastic RSI has performed a bullish crossover, suggesting the pair has more tendency to move to the north but needs stronger buying pressure.
To this end, a close above $617 would likely trigger a retest of the major $635 resistance. However, failure may attract a price deepening towards lower supports.
You can purchase crypto coins here. Buy LBlock