Solana (SOL) Price Prediction: SOL/USDT Dips Heavily in Two Sessions
Estimated Reading Time: 3 minutes
Don’t invest unless you’re prepared to lose all the money you invest. This is a high-risk investment and you are unlikely to be protected if something goes wrong. Take 2 minutes to learn more
Solana (SOL) Price Prediction: October 4
The Solana market crashed heavily as Bitcoin circles back towards lower price levels around $60,000. There are indications that the market may extend downward corrections further towards lower levels. Let’s take a closer look at the market to figure out where it may head from here.
SOL/USDT Long-term Trend: Bullish (Daily Chart)
Key Price Levels:
Resistance: $140.00, $150.00, $160.00
Support: $130.00, $120.00, $110.00
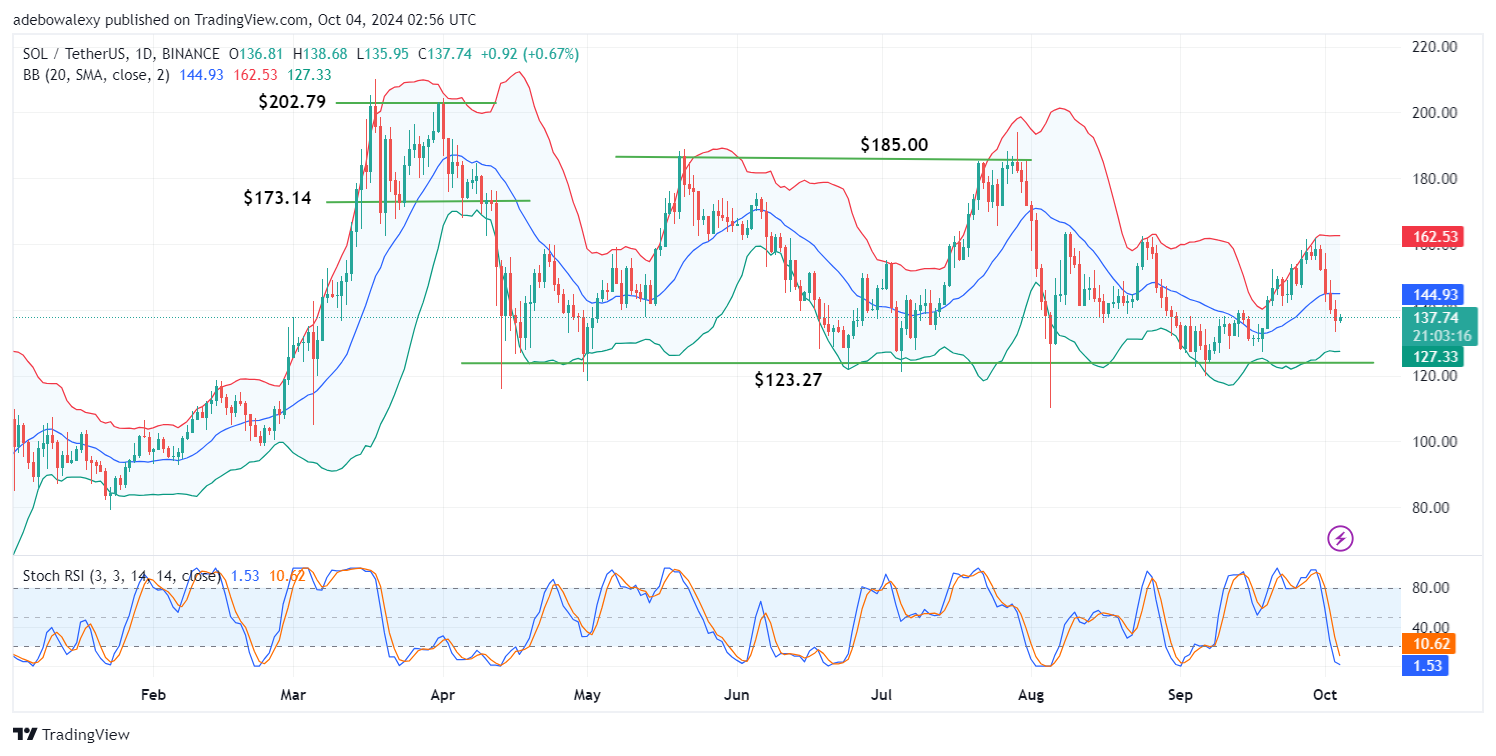
Price activity in the Solana daily market fell through the support formed by the middle limit of the Bollinger Bands in the past two sessions. The market subsequently broke through the $140.00 support level in the previous session. The ongoing session hints that price action seems to be hitting the brakes. Nevertheless, the market now lies under a stronger bearish influence, given its current position. At the same time, the Stochastic Relative Strength Index (Stochastic RSI) has reached deep into the oversold region.
Solana (SOL) Price Prediction: SOL/USDT Upside Correction Faces an Uphill Task
The ongoing session has shown that market participants are buying the dip. However, trading activity now occurs below the middle limit of the BB indicator, which confers a strong bearish tone on market movement.
Consequently, the minimal upward retracement seen may be pushed down shortly. Also, the Stochastic RSI remains in the oversold region, making buyers hesitant to mount significant pressure, as the market looks very bearish and only appealing to bearish traders.
Solana (SOL) Price Prediction: SOL/USDT Needs More Buying Activity (4-Hour Chart)
Price action in Solana’s 4-hour chart shows the token bouncing off the lower limit of the Bollinger Bands indicator. The last price candle continues on an upward path; however, it has both upper and lower shadows. Meanwhile, the Stochastic RSI lines can be seen rising from the oversold region.
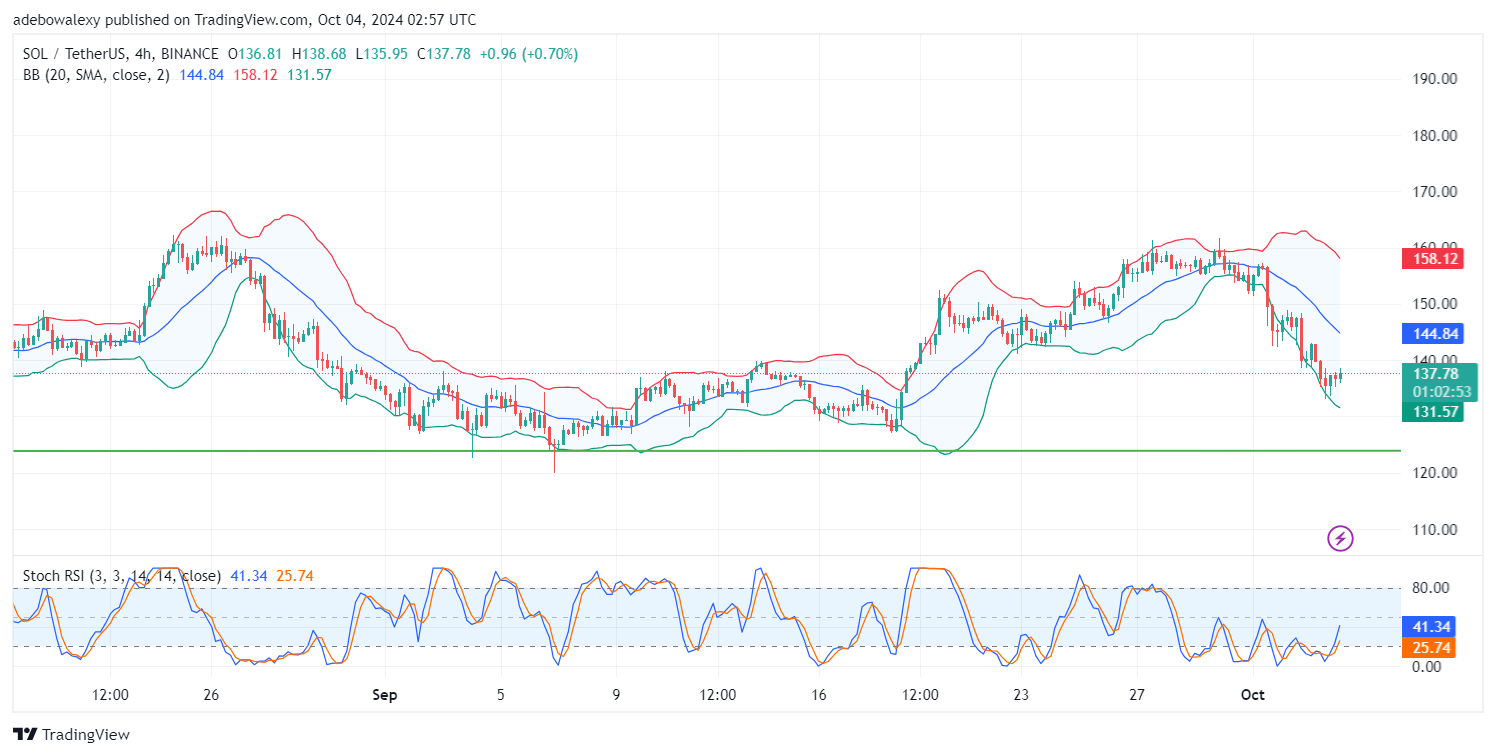
Price activity remains below the middle limit of the BB indicator, placing the upside retracement under significant bearish pressure. Even the appearance of shadows on the last price candle suggests that market forces are already acting on price movement. Consequently, this suggests that bullish traders should exercise caution, as the market may proceed towards the $130.00 threshold.