Bitcoin (BTC) Price Prediction: BTC/USDT Dips Heavily in Two Sessions
Estimated Reading Time: 3 minutes
Don’t invest unless you’re prepared to lose all the money you invest. This is a high-risk investment and you are unlikely to be protected if something goes wrong. Take 2 minutes to learn more

Bitcoin (BTC) Price Prediction: October 2
The price of Bitcoin has steadily increased over time, moving from the base level at the $53,704 threshold to above $60,000. However, over the past three sessions, the market has dipped significantly. Despite this, the ongoing session suggests that upward momentum may yet keep the market above the $60,000 threshold.
BTC/USDT Long-term Trend: Bullish (Daily Chart)
Key Price Levels:
Resistance: $65,000, $70,000, $75,000
Support: $60,000, $55,000, $50,000
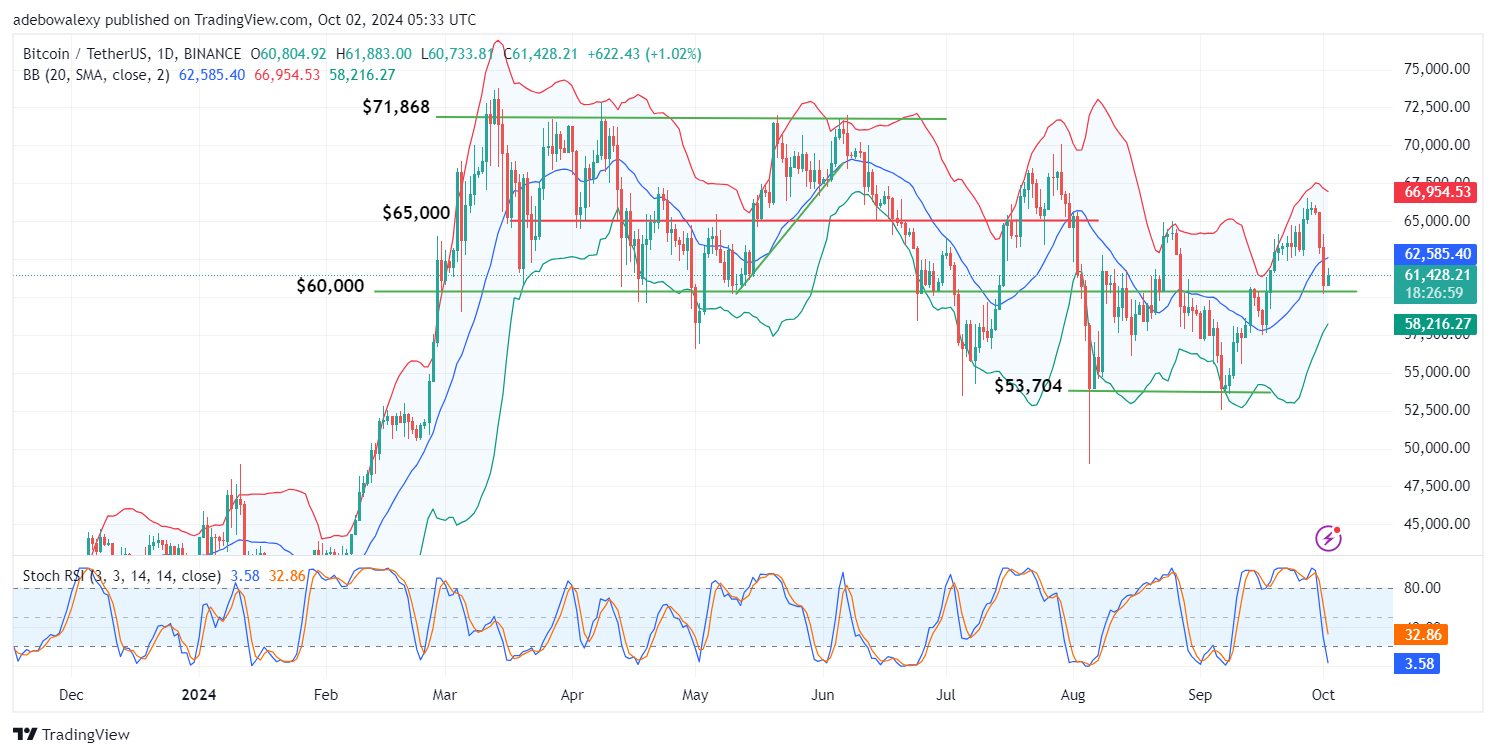
The most recent price candle on the daily chart has appeared just above the $60,000 threshold, with the coin now trading above $61,000. The Stochastic Relative Strength Index (Stochastic RSI) lines have fallen rapidly into the oversold region, currently sitting below the 35 mark. Likewise, the last price candle is positioned below the middle band of the Bollinger Bands (BB) indicator.
Bitcoin (BTC) Price Prediction: Will BTC/USDT Bounce Back?
Price activity has been fairly volatile since two sessions ago innthe Bitcoin daily market, yet the market has managed to stay above the $60,000 threshold. The most recent green price candle has appeared just below the middle band of the Bollinger Bands indicator.
While this may indicate a potential downtrend, the appearance of the green candle could suggest that downward pressure is easing. The Stochastic RSI lines have sharply dropped into the oversold region, and the last price candle shows an upper shadow, indicating that bearish forces remain active. Therefore, bullish traders may want to exercise caution.
Bitcoin (BTC) Price Prediction: BTC/USDT May Retest the $60k Support for a Break (4-Hour Chart)
Price activity on the Bitcoin 4-hour chart provides further insights into recent BTC/USDT movements. The market previously bounced off the $60,000 support level, and on the 4-hour chart, this appears to have occurred near the lower limit of the BB indicator.The most recent price candle is red, signaling that downward pressure is already in play.
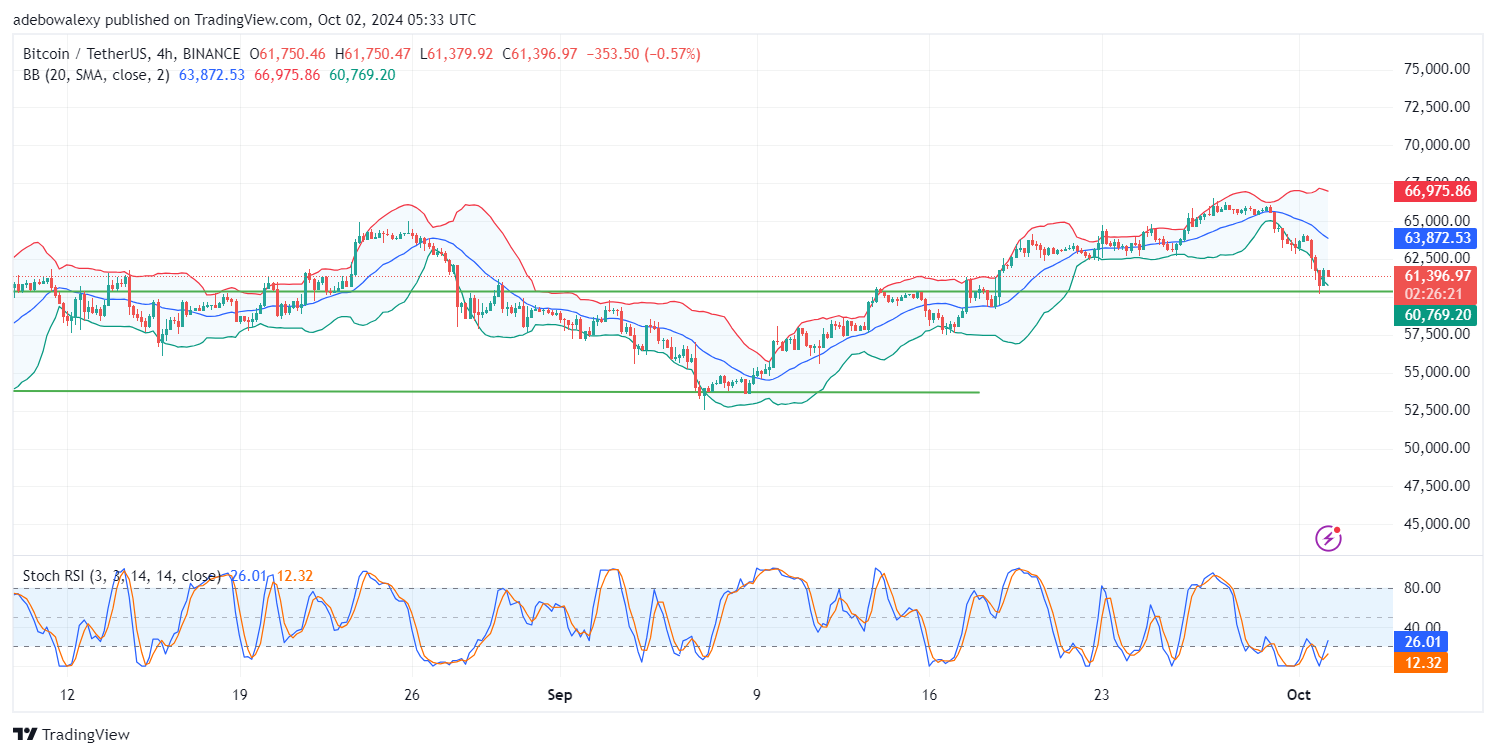
Meanwhile, the Stochastic RSI lines are trending upward after an upward crossover in the oversold region. Despite this, the market may continue downward. Bullish traders should consider entering long positions at or above the $62,000 threshold.