LIBRA (LIBRA/USD) Bearish Trend Slows Down Near Key $0.15 Support Level
Estimated Reading Time: 3 minutes
Don’t invest unless you’re prepared to lose all the money you invest. This is a high-risk investment and you are unlikely to be protected if something goes wrong. Take 2 minutes to learn more

This market appears to have launched recently, with the LIBRA market being a new entrant in the crypto space. Historical data traces its inception back to around February 14-15. Since its early days, the market has experienced significant bearish pressure, with today’s -4% decline further reinforcing the downtrend. The bearish sentiment has been evident on the 4-hour chart.
However, the downward momentum seems to be easing, as buyers are beginning to step in around the $0.15 price level. In this analysis, we will examine the market through the lens of key technical indicators to assess potential trends and opportunities.
The LIBRA Market Data
- LIBRA/USD Price Now: $0.15
- LIBRA/USD Market Cap: $38.6 million
- LIBRA/USD Circulating Supply: 256 million
- LIBRA/USD Total Supply: 999.9 million
- LIBRA/USD CoinMarketCap Ranking: #634
Key Levels
- Resistance: $0.16, $0.17, and $0.18
- Support: $0.14, $0.13, and $0.12.
The LIBRA Market Through the Lens of Indicators
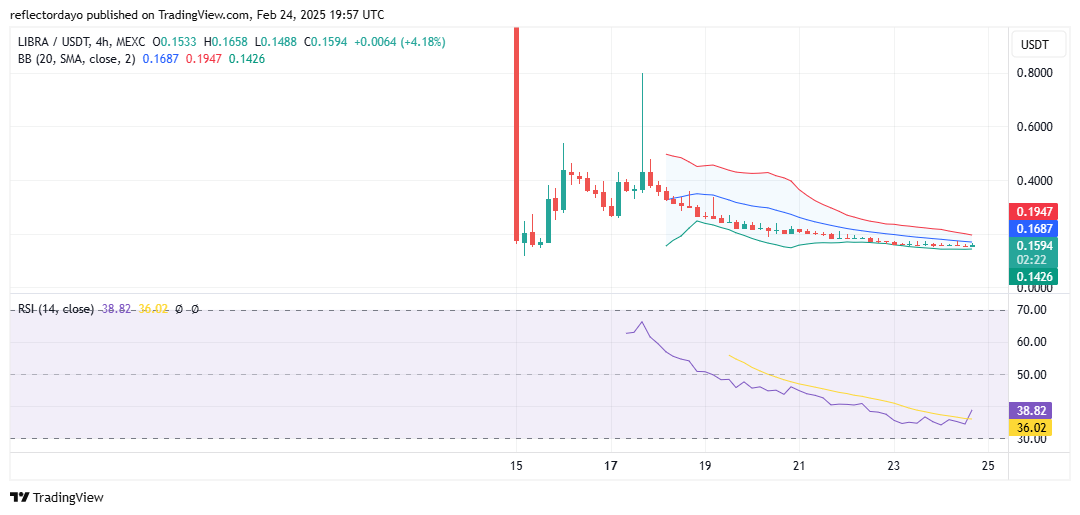
The LIBRA market has exhibited downward volatility, driving strong selling pressure. In its early days, the market quickly tested price zones between $0.15 and $0.12 before sharply rebounding. However, it failed to surpass its previous high, forming a lower high at $0.8 compared to the prior peak near $0.9.
The price has since declined to $0.15, where it appears to be stabilizing. The Bollinger Bands indicator reflects decreasing volatility, indicating a lack of strong pressure from either the demand or supply side. Given that the LIBRA market has previously tested this level since its launch, it is emerging as a key price zone—a potential inflection point. Traders may view this level with a bullish bias, but a decisive breakout or breakdown is likely imminent.
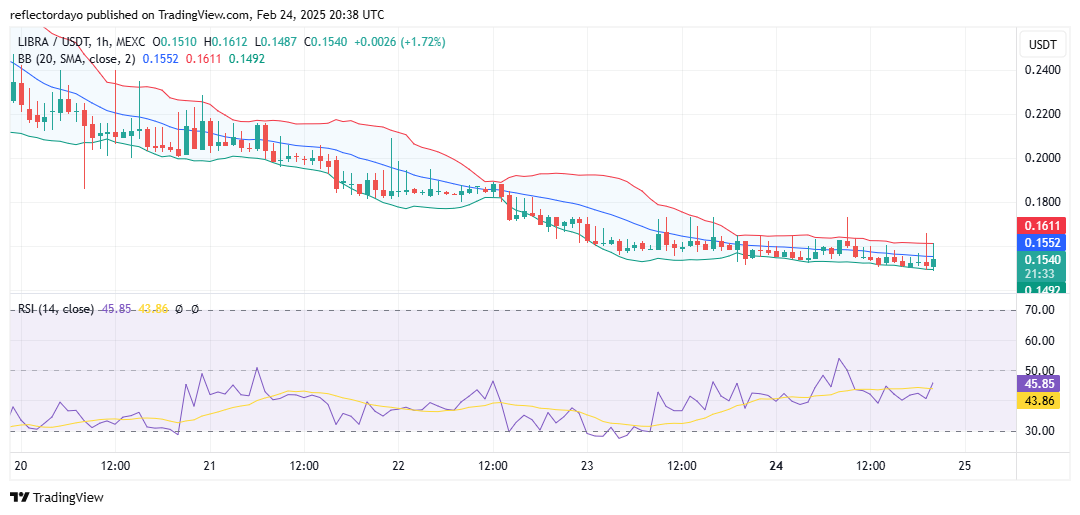
LIBRA/USD Price Prediction: 1-Hour Chart Analysis
Zooming into the 1-hour chart, we observe the potential for a market rebound and a strong recovery. As the bearish price action approaches the $0.15 level, the market has significantly slowed down. Additionally, we can identify a slight bullish divergence between price action and the Relative Strength Index (RSI). While price continues to trend downward, the RSI is showing signs of recovery, indicating that bullish sentiment may be emerging at this level.
However, given the sharp decline in the first two days after the market’s launch, traders should carefully consider the underlying fundamentals surrounding this asset before making any trading decisions.