Polkadot (DOT/USDT) Bullish Traders Eye Reversal at Historical Low
Estimated Reading Time: 3 minutes
Don’t invest unless you’re prepared to lose all the money you invest. This is a high-risk investment and you are unlikely to be protected if something goes wrong. Take 2 minutes to learn more

Polkadot Long-term Analysis: Ranging
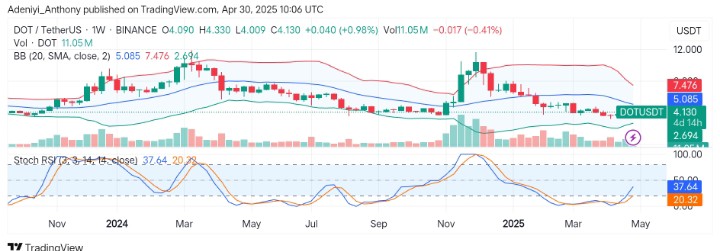
Polkadot against the Tether has experienced a prolonged downtrend from its previous year’s highs, falling into the oversold territory and hugging the lower segment Bollinger band even now. However, the price action around the $4.130 lower band suggests suppressed volatility with the potential for a breakout.
Meanwhile, the Stochastic RSI has begun to show signs of potential upside movement as the lines curl upside, hinting at an early bullish momentum building. To this end, this setup indicates the coin may be preparing for a short- to mid-term reversal move but awaits increasing bullish volume.
Currently, Polkadot trades at $4.130, recording over 11 million traded volumes for the week.
Technical Indicators
Major Resistance Levels: $5.085, $6.200, and $7.476
Major Support Levels: $4.000, $2.690, and $2.000
Polkadot Technical Analysis
The analysis of Polkadot against the Tether on the weekly chart shows that the pair is currently ranging as the price moves near the lower band, suggesting a mean reversion could be near. However, if the bulls can push the price above $5.085, a trend shift could be recorded.
On the other hand, the Stochastic RSI indicator signals the pair’s improvement as the lines prepare to leave the oversold region, suggesting an ideal long position once a volume spike is seen.
To this end, a close above $5.085 with an increased volume could push the price toward $7.476 in the near term; otherwise, a breakdown with a declining volume might lead to a dip below $4.000.
DOT/USDT Analysis: What’s Happening Here?
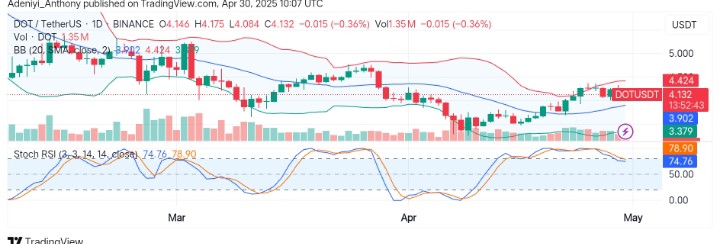
On the daily timeframe, DOT/USDT appears to be trading at $4.132 near the upper limit of the Bollinger Bands with a moderate trading volume of 1.35 million, showing neither accumulation nor distribution.
The trend has remained uptrend for a substantial part of the month. However, bullish strength may fade if resistance holds, as the recent candlesticks show hesitation near resistance.
From another angle, the Stochastic RSI shows an overbought condition as the blue retraced back to 74.76, suggesting potential short-term cooling.
To this end, an improvement in the values of the lines might lead to a break above $4.424 towards $5.085; otherwise, a pullback to $3.902 is likely.
You can purchase crypto coins here. Buy LBlock