HyperLiquid (HYPE/USDT) Finds Footing Amid Risk of Free Fall
Estimated Reading Time: 3 minutes
Don’t invest unless you’re prepared to lose all the money you invest. This is a high-risk investment and you are unlikely to be protected if something goes wrong. Take 2 minutes to learn more

The market for Hyperliquid against Tether is trading with a heavy bearish tone. This follows after a sharp rejection from the $41.64 resistance. However, the price appears to have collapsed -5.8% into the $39.23–$40.00 consolidation zone. Also, the failed recovery attempt today (topping at $40.87) signals exhaustion despite the spike in volume, as price action suggests a classic distribution pattern.
In recent times, traders are trapped between hope-fueled reversals and the reality of overhead supply. To this end, a breakdown below $39.23 could trigger panic as the pair seeks to find strong support.
Currently, Hyperliquid trades at $39.99 with over 370 traded volumes for the day.
Technical Indicators
Major Resistance Levels: $40.87, $42.64, and $42.50
Major Support Levels: $39.23, $38.50, and $37.00
Hyperliquid Technical Analysis
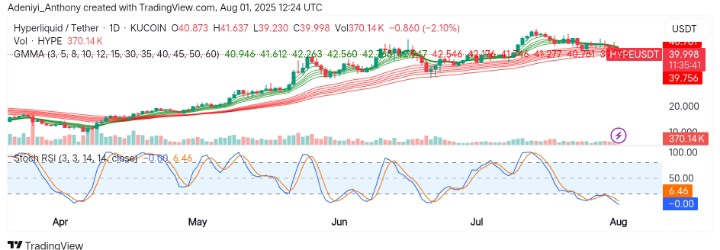
The market for Hyperliquid against Tether shows the bears are taking the bulls by the horns, applying pressure to the market, as the pair price heads south. However, the Guppy Multiple Moving Averages (GMMA) are bearishly stacked with the price operating underneath. This suggests that until the price climbs above the GMMA cluster ($42.50), rallies would remain selling opportunities.
On the other hand, the Stochastic RSI appears to be in the oversold region with lines facing the south. This shows selling pressure is at its peak, though, with the possibility of an upside correction in the near term.
To this end, a reversal of the current trend will hold at $42.64; otherwise, a continued move below $39.10 would be a continued downtrend.
HYPE/USDT Analysis: Expectations
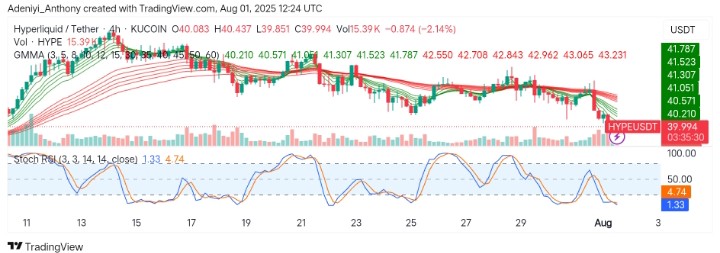
On the 4-hour chart, HYPE/USDT seems to be facing rejection with the formation of lower highs. However, all the lines of the GMMA face down with price trading underneath, reinforcing the daily downtrend.
Beneath the chart, the Stochastic RSI operates in the oversold region with no divergence, as the recent bounce lacks conviction. To this end, a critical support lies at $39.85, and a break beyond this level would signify a move towards $39.23. Until the $40.60 level is broken in this timeframe, sell pressure continues.
You can purchase crypto coins here. Buy LBlock