Dash 2 Trade Price Predictions for Today, September 27: D2TUSD Price is Trending Upward and This May Continue
Estimated Reading Time: 3 minutes
Don’t invest unless you’re prepared to lose all the money you invest. This is a high-risk investment and you are unlikely to be protected if something goes wrong. Take 2 minutes to learn more
Dash 2 Trade Price Forecast: D2TUSD Price is Trending Upward and This May Continue (September 27)
The D2TUSD market is currently trending upward and this may continue, as we are seeing a bullish correction in place. The coin gave a bullish breakout from the $0.00585 resistance level, suggesting that buyers are making a recovery attempt. Thus, if the crypto’s price sustains above the $0.00694 previous high value, the potential rally could surge higher to hit the $0.01000 supply trend line and beyond. Hence, it is a great opportunity and a clear buy signal for long-term investors.
Key Levels:
Resistance levels: $0.01000, $0.01100, $0.01200
Support levels: $0.00800, $0.00700, $0.00600
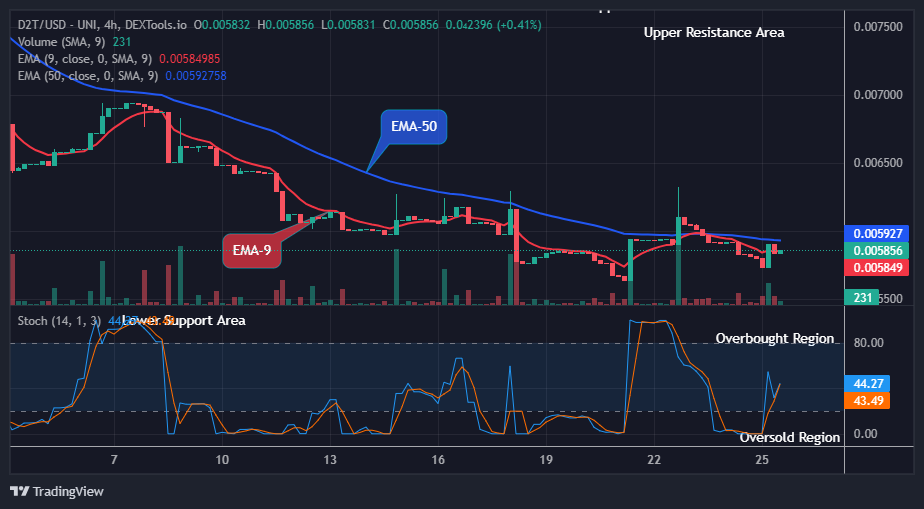
D2T (USD) Long-term Trend: Bearish (4H Chart)
Due to low volume from the long traders, the D2TUSD pair is in a bearish trend on the 4-hour chart. The coin price can be seen in green slightly below the EMAs.
Pressure from the short traders to a $0.00573 low level in the last session has contributed to its bearishness in its recent low.
Today, the Dash 2 Trade price rebounded after massive drops at the $0.00585 supply value below the EMAs to invalidate the bearish theory as the 4-hour chart opens. This however shows more concern from the long-term investors.
Hence, a potential breakout from the immediate resistance of $0.00694 value will give additional confirmation for a bullish recovery, if the bulls could increase their efforts in the market.
In a like manner, the momentum indicator which is pointing up indicates that the price of D2TUSD is in an uptrend and may possibly continue and remain in that direction to hit the $0.01000 supply level and beyond soon in the higher time projection.
D2T (USD) Medium-term Trend: Bullish (1H Chart)
The market price of Dash 2 Trade is currently trading in the bullish market zone. This is due to the gradual returns of the buy traders to the crypto market. The market shows that the price may now be trading in a new ascending channel.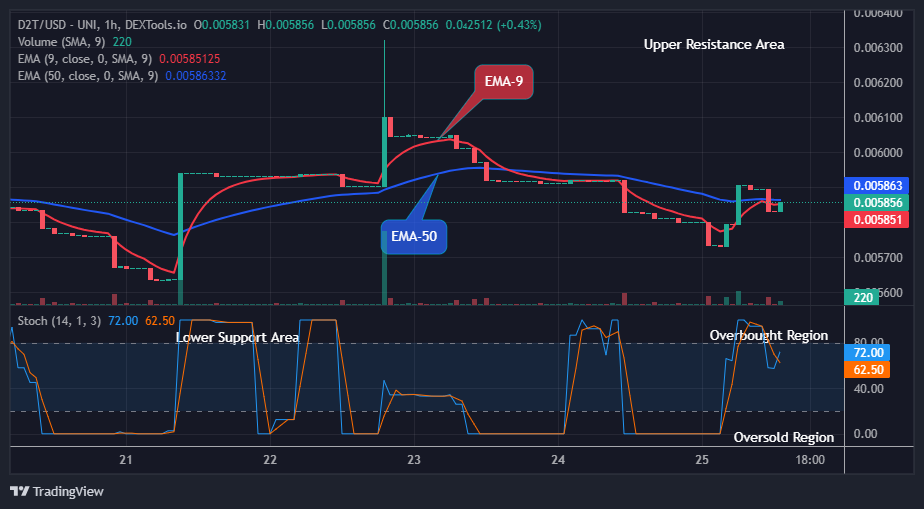
The bulls made a corrective rally up to a $0.00585 supply level above the EMA-9 shortly after the commencement of the 1-hour session today. This will enable buyers to influence the price tendency.
Therefore, a strong push by the long traders above the $0.00632 previous high point with a 1-hour candle closing could signify a shift in the market dynamics.
Concerning the daily signal, the market price of D2TUSD is situated in a bullish territory and will likely remain and continue in the same position, as a result, the bullish race might possibly reach the $0.01000 resistance level in the coming days in its medium-term outlook.
A new video has been released! How to harness the potential of our back tester.
🚀 New video is out! 🚀
— Dash 2 Trade (@dash2_trade) September 5, 2023
Learn to use the power of our backtester:
🔍In the video:
✅What is backtesting?
✅How to create and test a strategy
✅Main considerations
And much more!
Start backtesting and make every trade count!https://t.co/ZWGvoOWsFo
Want a coin that has a huge potential for massive returns? That coin is Dash 2 Trade. Buy D2T now.