Polkadot (DOT/USDT) Eyes Breakout as Market Sentiment Shifts
Estimated Reading Time: 3 minutes
Don’t invest unless you’re prepared to lose all the money you invest. This is a high-risk investment and you are unlikely to be protected if something goes wrong. Take 2 minutes to learn more
Polkadot Long-term Analysis: Bullish
Polkadot against the Tether has shown a flicker of strength this week by rebounding from multiple lows as the pair’s longer-period market outlook starts to shift from being seller-dominated to a cautious optimism to the north. This week, Polkadot has seen close to a 5% gain above the opening price after bouncing off the $3.68 support level.
Recently, the pair was compressing after a prolonged downtrend in the late year and early 2025. To this end, the Guppy Multiple Moving Averages (GMMAs) and Stochastic RSI are beginning to reflect change in market direction as the indicators signal improvement.
Currently, Polkadot trades at $4.067, recording over 13 million traded volumes for the week.
Technical Indicators
Major Resistance Levels: $4.630, $5.175, and $5.694
Major Support Levels: $3.680, $3.400, and $3.000
Polkadot Technical Analysis
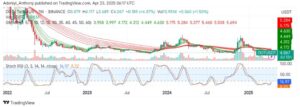
Technically, on the weekly timeframe, Polkadot against the Tether appears to be compressed, with the GMMAs signaling exhaustion in bearish pressure as the short-period EMAs converge toward the longer-period EMAs, suggesting the possibility of a trend reversal.
On the other hand, the Stochastic RSI, though in the oversold zone, has signaled a potentiality to the north with a bullish crossover as the price moves upward.
To this end, the price needs to break above $4.200 for a confirmed upside movement; otherwise, the accumulation phase may be extended.
DOT/USDT Analysis: What’s Happening Here?
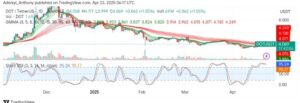
On the daily chart, DOT/USDT attempts a short-term reversal from a prolonged downtrend with trade above the $4.000 psychological level. However, the GMMAs are beginning to flatten out, signaling a weakened selling pressure as the price tests $4.07 dynamic resistance.
From another angle, the Stochastic RSI indicates an overbought condition, suggesting a possible pullback or consolidation before another northbound movement.
To this end, a close above $4.13 may open the door for a move above $4.630. However, holding $3.98 keeps the bullish move intact in the case of a pullback.
You can purchase crypto coins here. Buy LBlock