Polkadot (DOT/USDT) Hints at a Potential Recovery Above $6.192 Dynamic Level
Estimated Reading Time: 3 minutes
Don’t invest unless you’re prepared to lose all the money you invest. This is a high-risk investment and you are unlikely to be protected if something goes wrong. Take 2 minutes to learn more
Polkadot Long-term Analysis: Bullish
The market for Polkadot against the Tether crypto pair appears to be stabilizing after a significant period of downtrend. However, recent weekly gains suggest bullish momentum is building up as the buyers struggle to push the price above the dynamic band level.
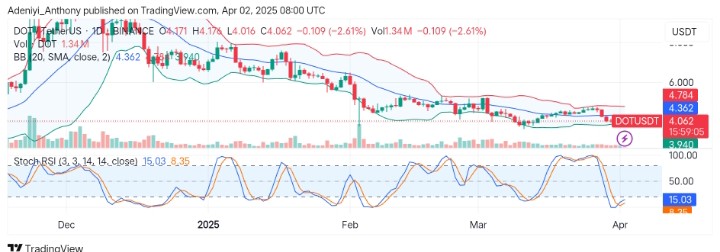
Recently, Polkadot has gone down to the south after hitting its peak around the $10 level. For some periods, the pair has been correcting continuously, breaking below several supports along the line and testing new ones. However, the pair has shown a consolidation above the $4.000 level, suggesting a potential accumulation as the Stochastic RSI signals more gains to come.
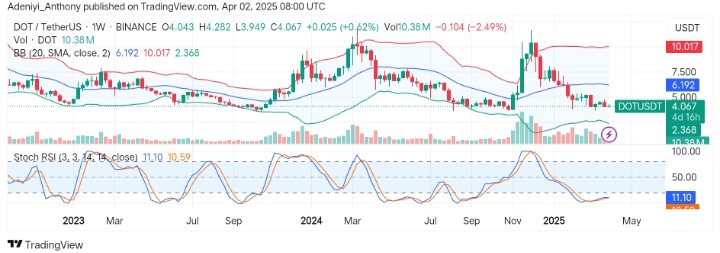
Currently, Polkadot trades at $4.067, recording over 10 million traded volumes for the week already.
Technical Indicators
Major Resistance Level: $4.362, $6.192, and $7.500
Major Support Levels: $4.000, $3.000, and $2.368
Polkadot Technical Analysis
Polkadot’s analysis against the Tether on a weekly timeframe shows that the pair is currently in a neutral phase, building momentum as the pair records gain. However, the appearance of the pair around the lower segment of the Bollinger bands suggests the pair’s upside movement lacks strong conviction, but with increasing bullish volume, a break above $4.300 will indicate a good entry point for more northbound movement.
On the other hand, the Stochastic RSI appears to be in the oversold region, suggesting the pair is due for a bounce as the blue line advances towards the 12-mark level. However, for a strong reversal, it needs to break above the 20-mark level to confirm a bullish momentum.
DOT/USDT Analysis: Where from Here?
The analysis of DOT/USDT on the chart shows the pair sees strong selling pressure, dipping 2.61% to the south as selling pressure increases. However, the price action around the lower Bollinger bands indicates the pair hopes to hold above the critical level of $3.940.
On the other hand, the oscillator signals an oversold condition. However, the positioning of the lines suggests that the price might see a relief bounce soon as the lines move towards the 20-mark level.
To this end, a break above $3.940 could lead to further losses, while reclaiming $4.362 may lead to the start of a short-term Polkadot recovery.
You can purchase crypto coins here. Buy LBlock