Binance Coin (BNB) Makes Positive Moves but Lacks Buyers at a Higher Price Levels
Estimated Reading Time: 2 minutes
Don’t invest unless you’re prepared to lose all the money you invest. This is a high-risk investment and you are unlikely to be protected if something goes wrong. Take 2 minutes to learn more

Binance Coin (BNB) Long-Term Analysis: Bearish
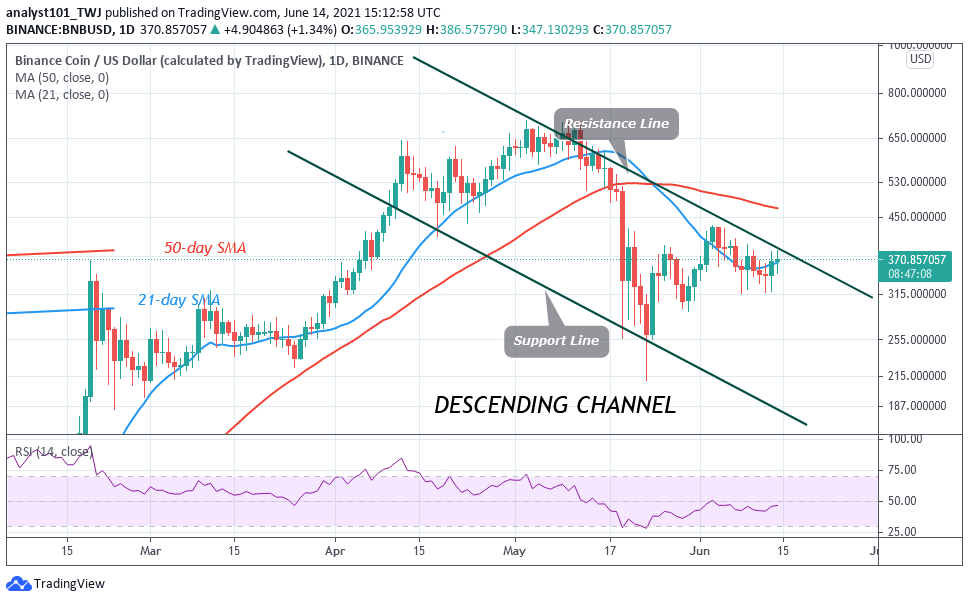
Binance Coin (BNB) has retested the $315 support severally before resuming upward. The crypto’s price has broken above the 21-day SMA but below the 50-day SMA. BNB will resume an upward move if price breaks above the SMAs. The current bullish move is facing resistance at the $380 high as price retraces to $360 support. On the upside, if price breaks the $380 resistance, a rally to $430 high is likely.
Binance Coin (BNB) Indicator Analysis
BNB has risen to level 47 of the Relative Strength Index period 14. It indicates that the altcoin is in the downtrend zone and below the centerline 50. BNB is above the 75% range of the daily stochastic. It indicates that BNB/USD is in a bullish momentum. BNB has a bearish crossover as the 21-day SMA crosses above the 50-day SMA.

Technical indicators:
Major ResistancIs ie Levels – $640, $660, $680
Major Support Levels – $540, $520, $500
What Is the Next Direction for Binance Coin (BNB)?
The altcoin has resumed an upward move. Meanwhile, on June 13 uptrend; a retraced candle body tested the 78.6% Fibonacci retracement level. The retracement indicates that the coin will rise and reverse at level 1.272 Fibonacci extension or a level of $380.06. The crypto has already tested the 1.272 Fibonacci extension. The price is likely to retrace to 78.6% Fibonacci retracement level.

Note: new.cryptosignals.org is not a financial advisor. Do your research before investing your funds in any financial asset or presented product or event. We are not responsible for your investing results