The Flow Market (FLOW/USD) Struggles to Reclaim $0.50 Resistance
Estimated Reading Time: 3 minutes
Don’t invest unless you’re prepared to lose all the money you invest. This is a high-risk investment and you are unlikely to be protected if something goes wrong. Take 2 minutes to learn more

The Flow market (FLOW/USD) has maintained significant importance around this price level for an extended period. This level played a crucial role in the last bullish run late last year, serving as a stronghold for buyers.
For a long time, the bulls have defended this level, preventing the bears from pushing the price below it. Before the most recent bullish breakout, the market experienced prolonged consolidation, as both bulls and bears struggled for dominance. This indicates that the bears have been targeting a breakdown below the $0.50 level for some time. A decisive break below this key support could be critical for traders, potentially signaling further downside momentum.
FLOW Market Data
- FLOW/USD Price Now: $0.41
- FLOW/USD Market Cap: $455 million
- FLOW/USD Circulating Supply: 1.56 billion
- FLOW/USD Total Supply: 1.56 billion
- FLOW/USD CoinMarketCap Ranking: #89
Key Levels
- Resistance: 0.60, $0.70, and $0.80
- Support: 0.40, $0.30, and $0.20
The Flow Market Through the Lens of Indicators
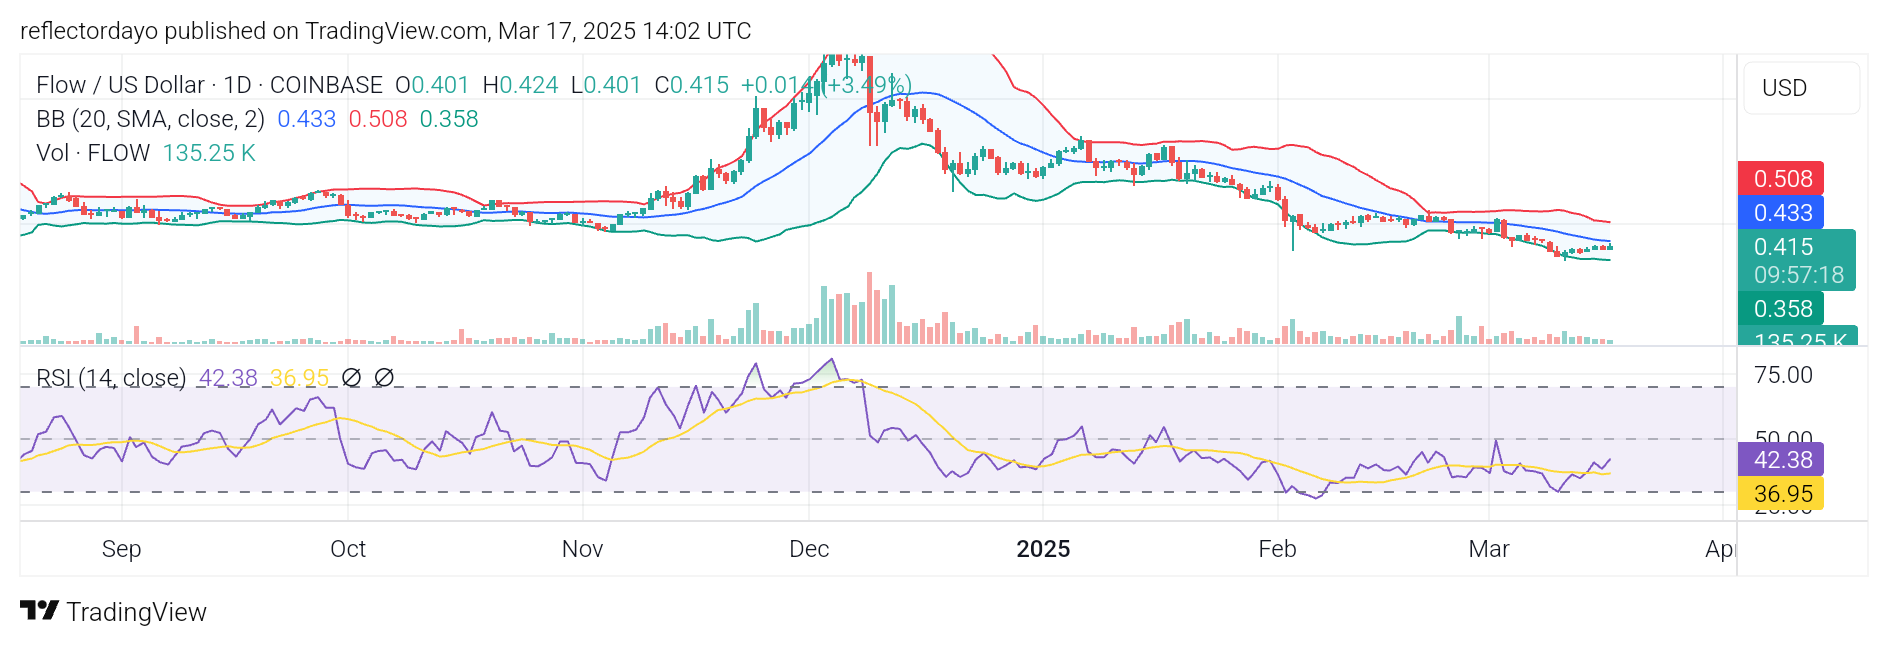
The bulls’ stronghold at the $0.50 price level led to a breakout in price action toward the end of last year, fueling a bullish run that peaked near $1.50. However, growing profit-taking activity at the market’s peak in early December initiated a downward trend.
Despite this, the bearish momentum was significantly slowed by prevailing bullish sentiment in the market. By February, bears began testing levels below $0.50 and eventually broke through in early March. Since then, they have maintained control, turning $0.50 into a resistance level. The Flow market price has continued to struggle beneath this threshold since the breakdown.
Typically, when such a long-standing price level is breached in the crypto signal, it triggers increased bearish sentiment, potentially driving prices further downward. However, the bulls have shown renewed strength, yet, traders remain cautious, this resulting in consolidation of the price action. With $0.50 now acting as resistance, this could explain why the recovery appears weak, as bearish bias dominates the level.
If both demand and supply maintain equal strength, a consolidation phase along this price line may resume, with bears still holding control over the $0.50 level.
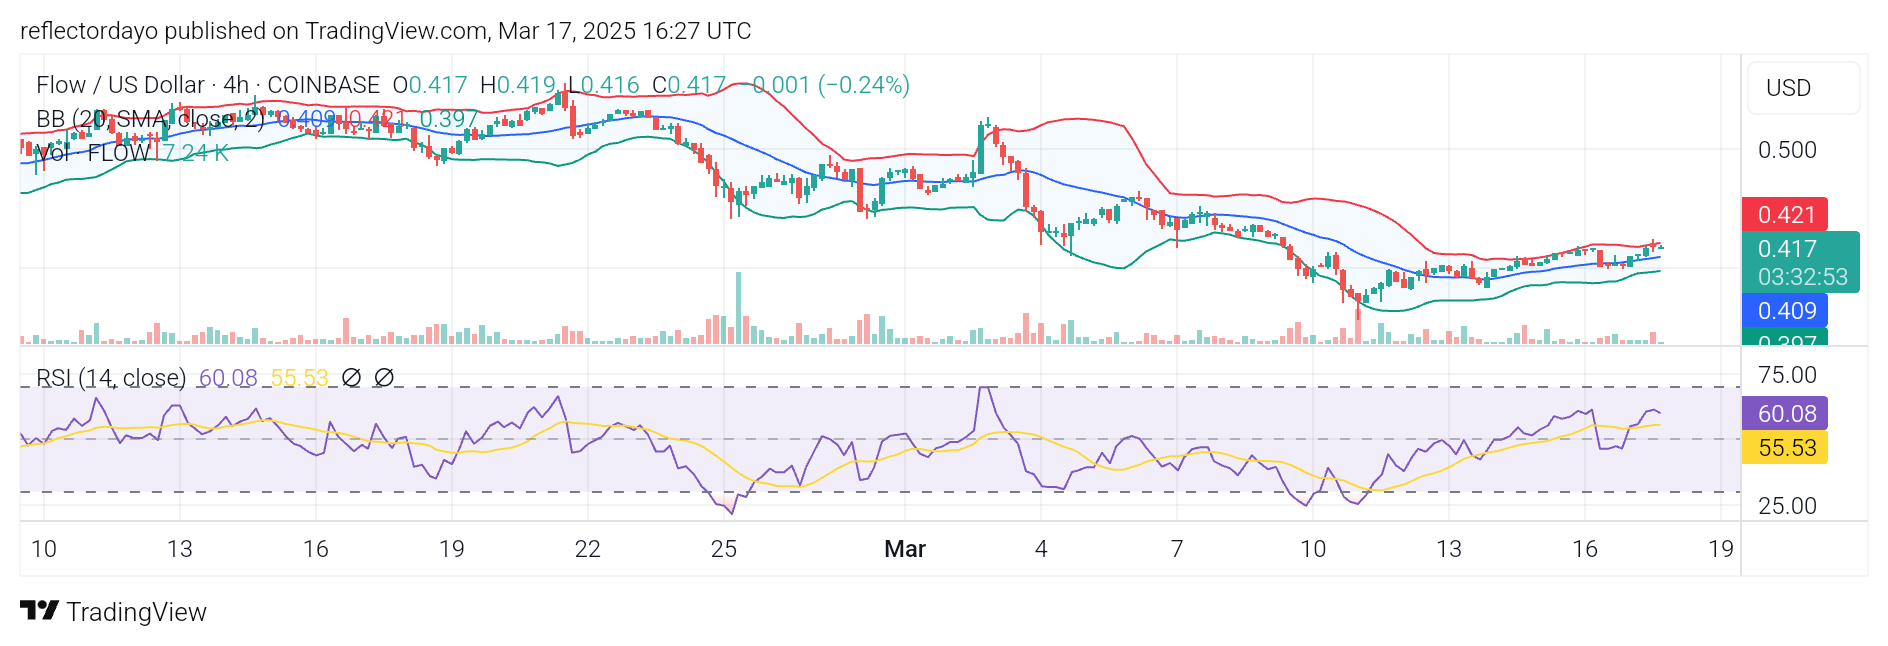
FLOW/USD Price Prediction: 4-Hour Chart Analysis
The Flow market, as analyzed from the 4-hour chart, further confirms the possibility of a consolidation phase around the $0.50 level. Price action established a pivotal support at $0.35, where buying interest emerged, leading to a retracement and partial recovery.
However, the formation of resistance below $0.50 suggests that bears have maintained a firm grip on the market. Notably, a new resistance level has developed around $0.40, reinforcing bearish dominance. Capitalizing on the breakdown below the critical $0.50 level, bears remain optimistic about further downside movement.
Nevertheless, if bulls can hold support at $0.36, the market may either continue consolidating or stage a breakout in the coming sessions.