Chainlink (LINK) Retraces, Faces Strong Rejection at $36 Resistance
Estimated Reading Time: 2 minutes
Don’t invest unless you’re prepared to lose all the money you invest. This is a high-risk investment and you are unlikely to be protected if something goes wrong. Take 2 minutes to learn more
Chainlink (LINK) Long-Term Analysis: Bullish
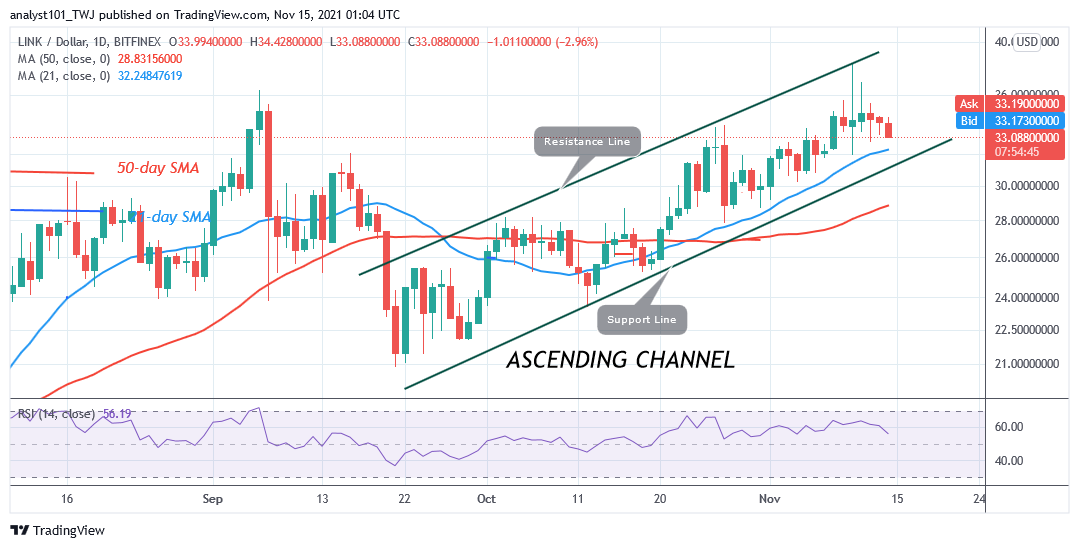
Chainlink’s (LINK) price is still falling on the downside after the rejection at $36. LINK price is falling and approaching the 21-day line moving average. If Chainlink falls and finds support above the 21-day line moving average, the current selling pressure is likely to be over. Nevertheless, if the bears break below the 21-day SMA, Chainlink will further decline on the downside. The cryptocurrency will decline to the low of $21. Meanwhile, On November 10 price action, a candlestick with a long tail tested the 21-day line moving average or $31 support and pulled back. This is an indication that the current downtrend will be short-lived.
Chainlink (LINK) Indicator Analysis
Chainlink is at level 56 of the Relative Strength index period 14. The cryptocurrency has been stable in the uptrend zone. The altcoin will rise as long as it is above the moving averages. The 21-day and 50-day SMA are sloping upward indicating the uptrend. LINK is below the 50% range of the daily stochastic. The market is in a bullish momentum.
Technical indicators:
Major Resistance Levels – $40.00, $42.00, $44.00
Major Support Levels – $26.00, $24.00, $22.00
What Is the Next Direction for Chainlink (LINK)?
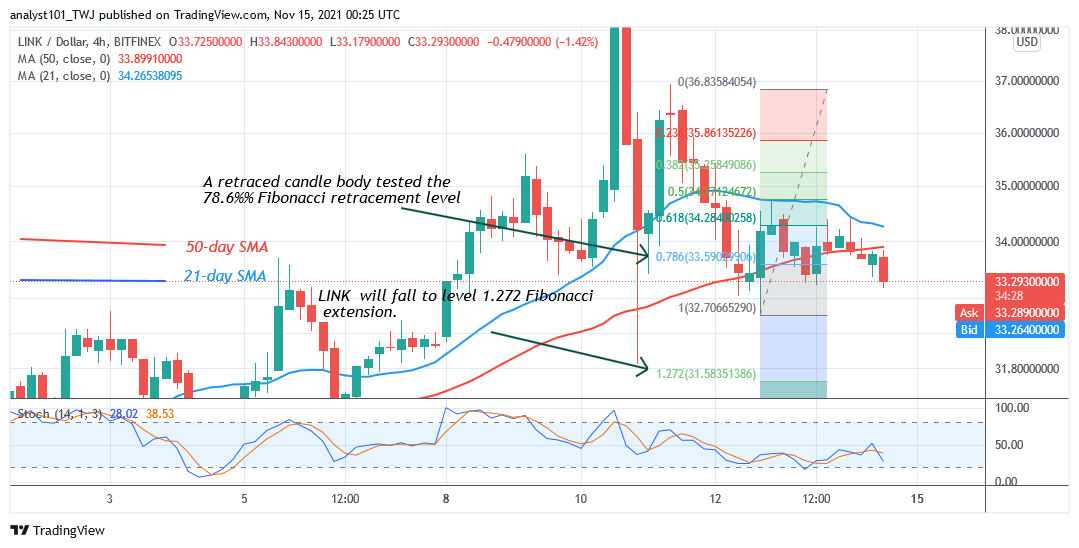
On the 4-hour chart, LINK is in a downward move. LINK/USD has broken below the moving average and it is approaching the previous low at $32. Meanwhile, on November 12 downtrend, a retraced candle body tested the 78.6%% Fibonacci retracement level. The retracement indicates that LINK will fall to level 1.272 Fibonacci extension or $31.58.
You can purchase crypto coins here. Buy Token
Note: Cryptosignals.org is not a financial advisor. Do your research before investing your funds in any financial asset or presented product or event. We are not responsible for your investing results